Fig. 13.
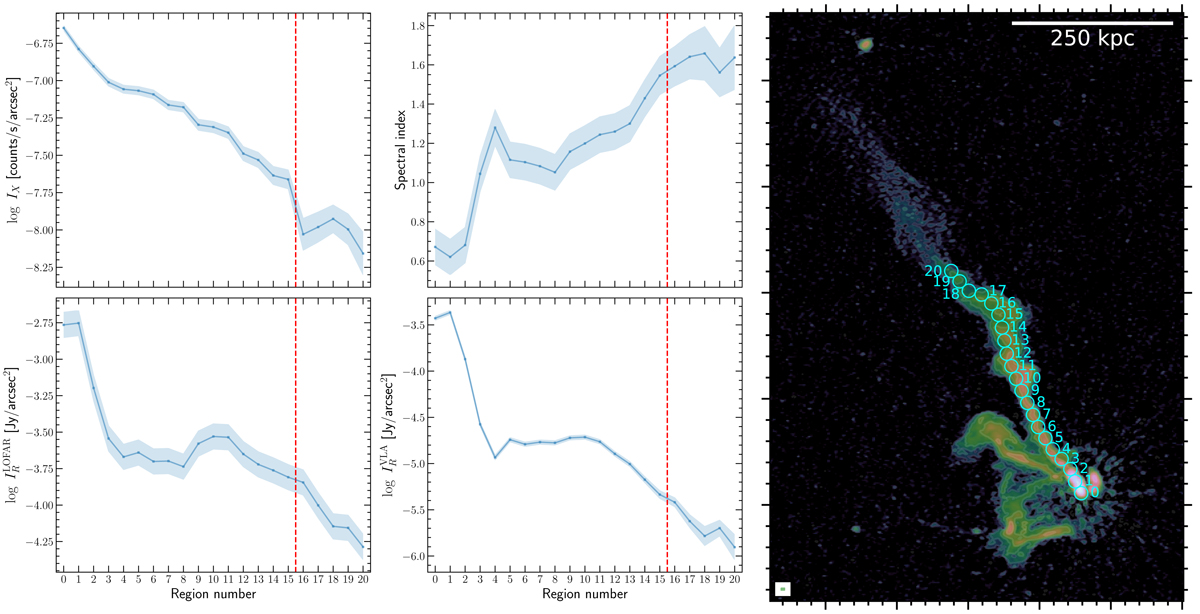
Spectral index, LOFAR, and VLA radio surface brightness (IR), and Chandra X-ray surface-brightness (IX) trends along the head-tail radio galaxy. Radio surface brightnesses and spectral indexes were computed from LOFAR and VLA C-array images with a beam of 15″ × 15″. Measurements were performed in the cyan beam-sized circular regions reported in the right panel, which depicts the same LOFAR high-resolution image of Fig. 6 for visualization purposes only (the beam is shown in the bottom left corner). Regions are numbered from 0 (head of the tail) to 20 (last region where the VLA emission is > 3σ). The red dashed vertical line on the left panels denotes the location of the arc-shaped cold front.
Current usage metrics show cumulative count of Article Views (full-text article views including HTML views, PDF and ePub downloads, according to the available data) and Abstracts Views on Vision4Press platform.
Data correspond to usage on the plateform after 2015. The current usage metrics is available 48-96 hours after online publication and is updated daily on week days.
Initial download of the metrics may take a while.