Fig. 11.
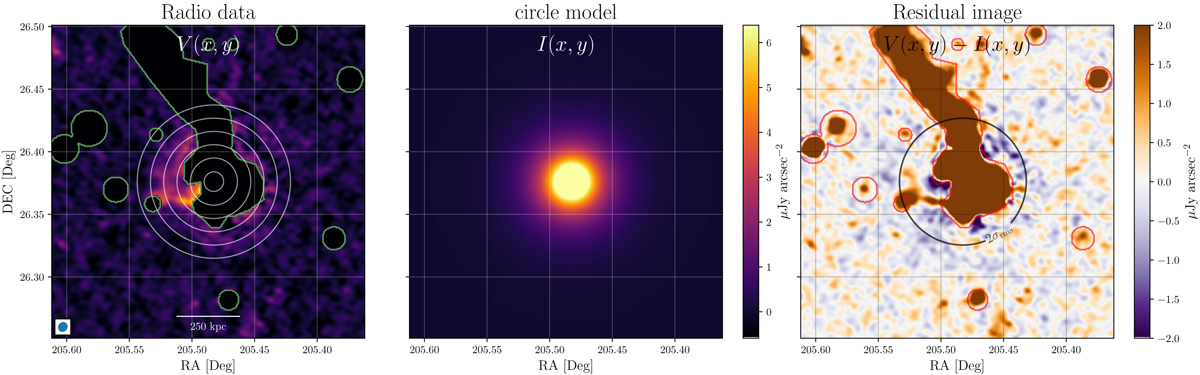
Fitting result obtained with HALO-FDCA (Boxelaar et al. 2021). Left: LOFAR low-resolution image used for the fit. Contaminating regions are masked out and contoured in green. The circular contours show the model at [1, 2, 4, …, 32]×σ levels. Center: image of the best-fit circular model. Right: residual image of the fit. The circle shows the 2σ level of the model. The red contours shows the masked regions. The χ2/d.o.f. of the fit is 1422.35/828. The MCMC corner plot of the fit is reported in Appendix B.
Current usage metrics show cumulative count of Article Views (full-text article views including HTML views, PDF and ePub downloads, according to the available data) and Abstracts Views on Vision4Press platform.
Data correspond to usage on the plateform after 2015. The current usage metrics is available 48-96 hours after online publication and is updated daily on week days.
Initial download of the metrics may take a while.