Fig. 4.
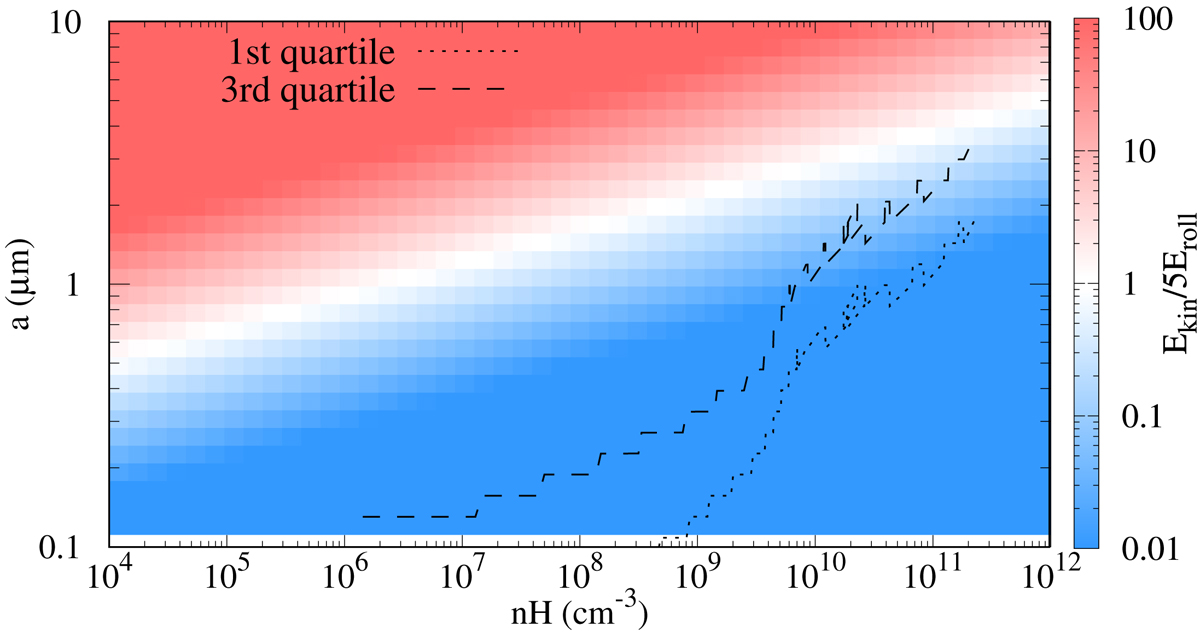
Ratio Ekin/5Eroll as a function of density (x-axis) and the largest of the two colliding grains (y-axis). Blue indicates a ratio below 1, meaning that the collision restructures or fragments the grains. The dotted and dashed lines are the first and third quartile of the MRN size distribution that coagulate during the protostellar collapse presented in Sect. 2.3.
Current usage metrics show cumulative count of Article Views (full-text article views including HTML views, PDF and ePub downloads, according to the available data) and Abstracts Views on Vision4Press platform.
Data correspond to usage on the plateform after 2015. The current usage metrics is available 48-96 hours after online publication and is updated daily on week days.
Initial download of the metrics may take a while.