Fig. 4.
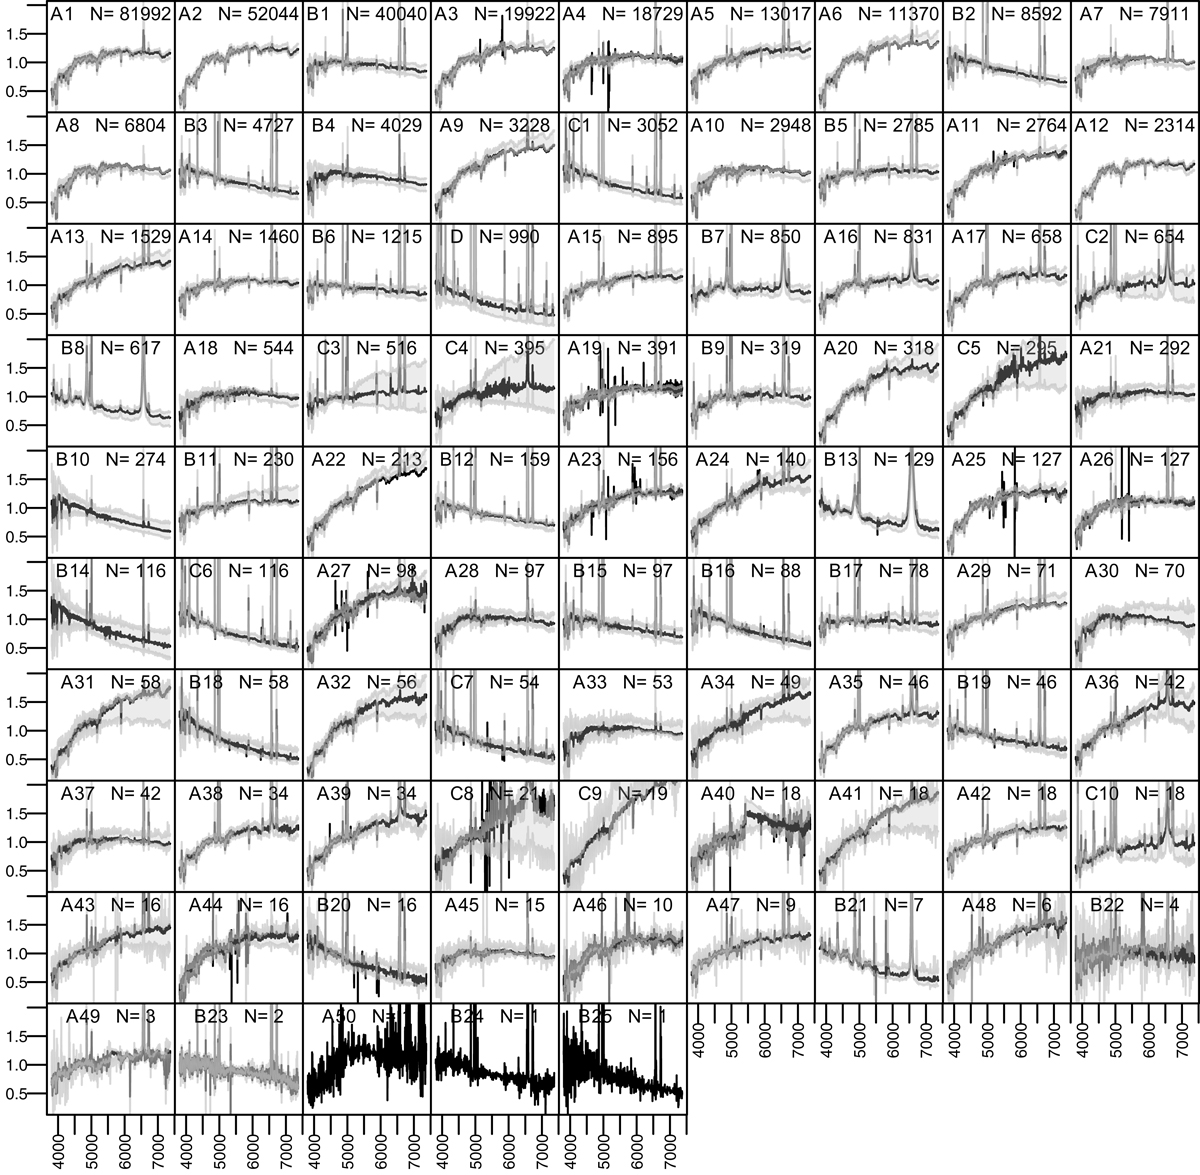
Resulting 86 classes of the present study stored in decreasing order of the number of spectra within a class. The black line indicates the mean spectrum of each class, and the grey zone lies between the 10% and 90% quantiles for that class. The vertical scale is arbitrary and identical for all spectra. The class index and the number N of objects in the class are given in each graph.
Current usage metrics show cumulative count of Article Views (full-text article views including HTML views, PDF and ePub downloads, according to the available data) and Abstracts Views on Vision4Press platform.
Data correspond to usage on the plateform after 2015. The current usage metrics is available 48-96 hours after online publication and is updated daily on week days.
Initial download of the metrics may take a while.