Open Access
Fig. C.4.
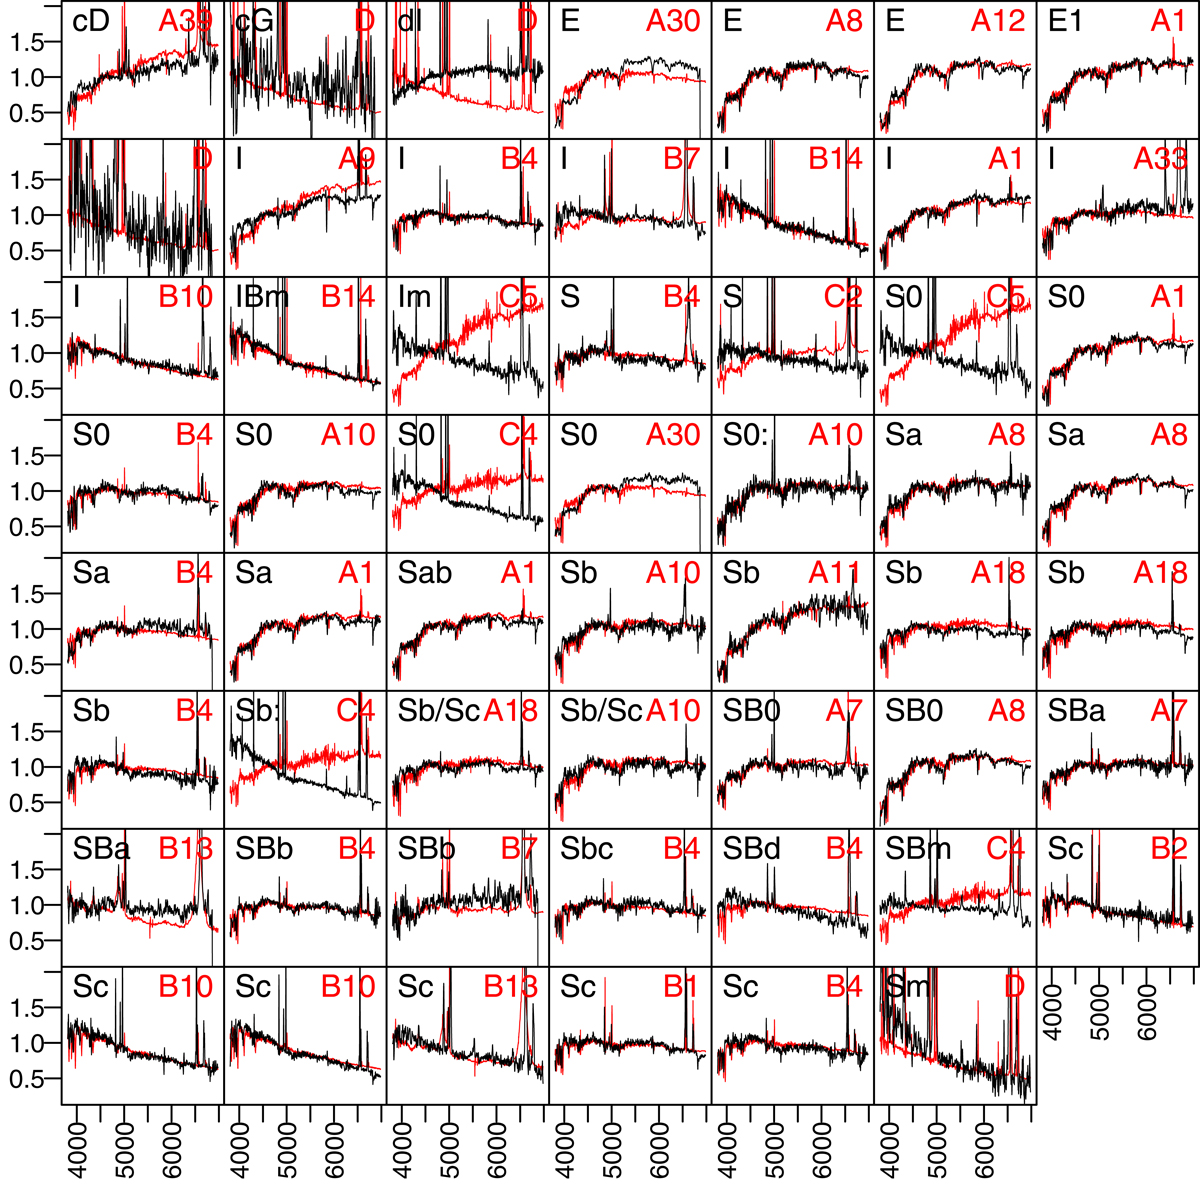
Match of the atlas by Kennicutt (1992) to our classes using the E-step. See Sect. 7.2. The strong discrepancies in the fits for some classes (dI, Im, SO, Sb:) are due to very strong and thin emission lines in the Kennicutt (1992) spectra. The fits are strongly improved when these spectra are smoothed to reduce the noise.
Current usage metrics show cumulative count of Article Views (full-text article views including HTML views, PDF and ePub downloads, according to the available data) and Abstracts Views on Vision4Press platform.
Data correspond to usage on the plateform after 2015. The current usage metrics is available 48-96 hours after online publication and is updated daily on week days.
Initial download of the metrics may take a while.