Fig. 1.
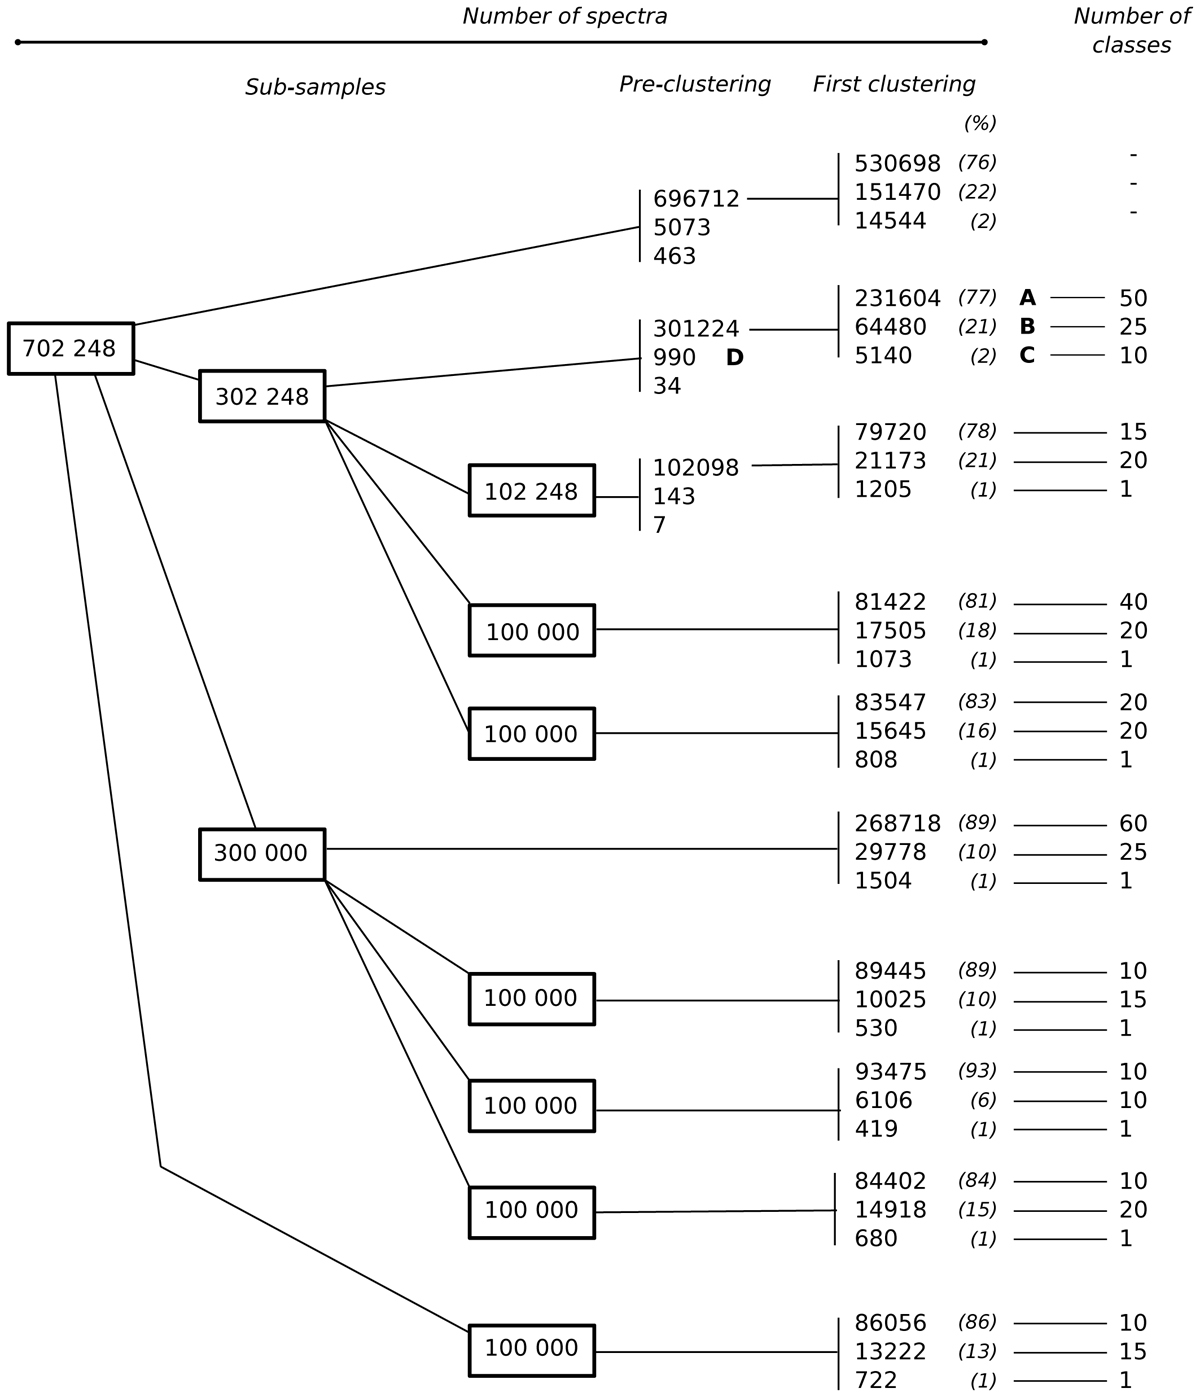
Summary of all the clustering analyses performed on different sub-samples. The size of each sample is given in the boxes, and the sizes of the different classes are given in the first two columns to the right, with the percentages given in parentheses. The optimum number of classes is given in the last column to the right. The three upmost samples required a pre-clustering with K = 3 before the first clustering also with K = 3 on the largest class gathering more than 99% of the spectra. The analysis of the full sample (702 248 spectra) was not pursued after the second pre-classification for excessive computation time. The four main classes A, B, C and D are indicated in boldface.
Current usage metrics show cumulative count of Article Views (full-text article views including HTML views, PDF and ePub downloads, according to the available data) and Abstracts Views on Vision4Press platform.
Data correspond to usage on the plateform after 2015. The current usage metrics is available 48-96 hours after online publication and is updated daily on week days.
Initial download of the metrics may take a while.