Fig. 9
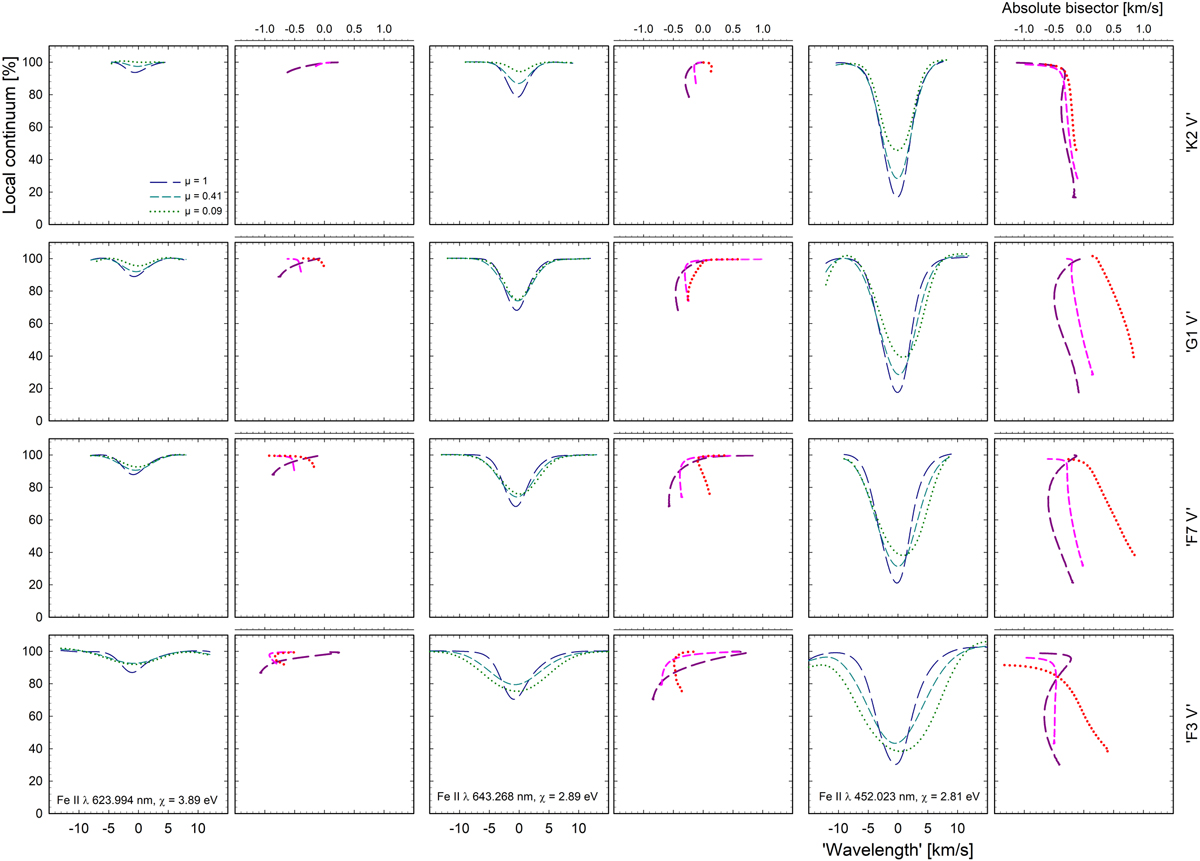
Line-strength dependence for Fe II lines. The profiles (axes at bottom of each frame) and bisectors (tenfold expanded axes at top) are followed through four different models of successively increasing temperature. Two leftmost columns: weak line; two central columns: one of medium strength, with a strong line in the two rightmost columns. From top down: ‘K2 V’, ‘G1 V’, ‘F7 V’, and ‘F3 V’. The long-dashed profiles and bisectors are for disk centers at μ = 1, short-dashed for μ = 0.41, and dotted for near-limb data at μ = 0.09.
Current usage metrics show cumulative count of Article Views (full-text article views including HTML views, PDF and ePub downloads, according to the available data) and Abstracts Views on Vision4Press platform.
Data correspond to usage on the plateform after 2015. The current usage metrics is available 48-96 hours after online publication and is updated daily on week days.
Initial download of the metrics may take a while.