Fig. 7
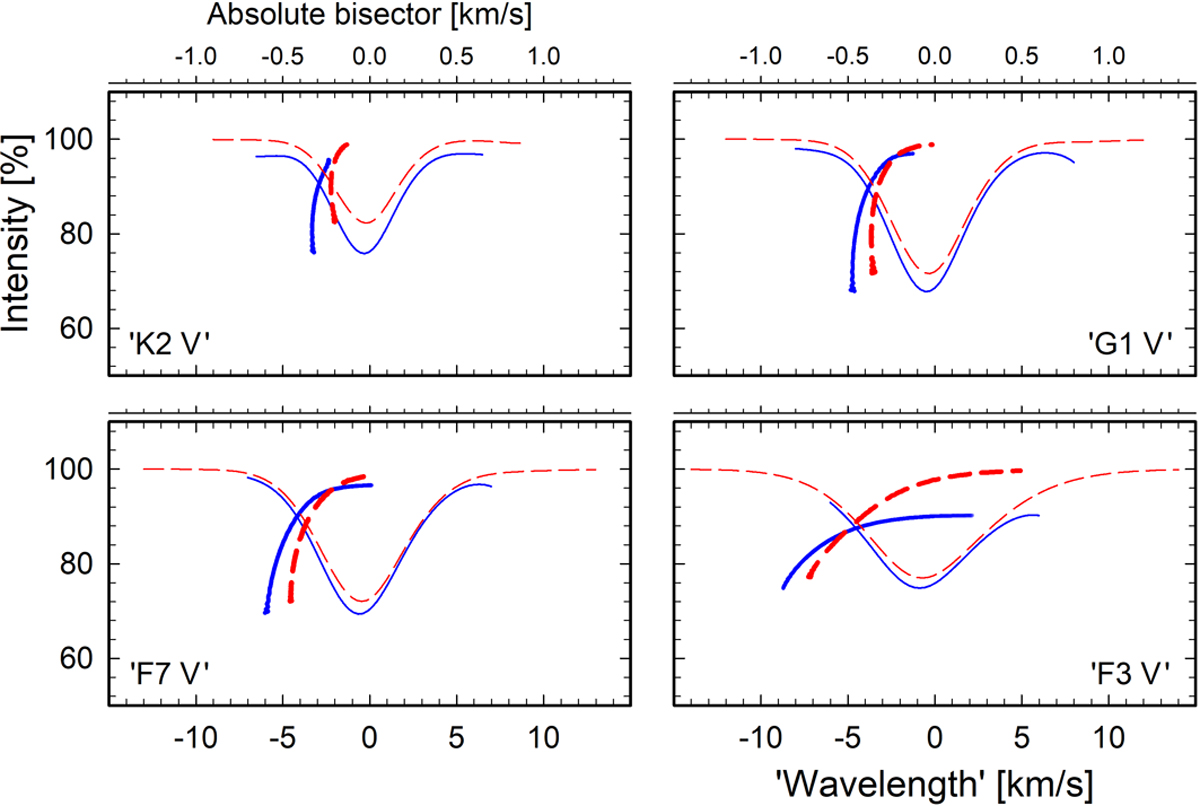
Convective line shifts depend on wavelength region. Bisectors (tenfold expanded top axes) and profiles (bottom) for spectral lines of similar strength and excitation potential in short- and long-wavelength regions show effects of greater granulation contrast in the blue than in the red. Solid blue curves: Fe II λ 467.017 nm, χ = 2.58 eV; dashed red: Fe II λ 643.268 nm, χ = 2.89 eV.
Current usage metrics show cumulative count of Article Views (full-text article views including HTML views, PDF and ePub downloads, according to the available data) and Abstracts Views on Vision4Press platform.
Data correspond to usage on the plateform after 2015. The current usage metrics is available 48-96 hours after online publication and is updated daily on week days.
Initial download of the metrics may take a while.