Fig. 6
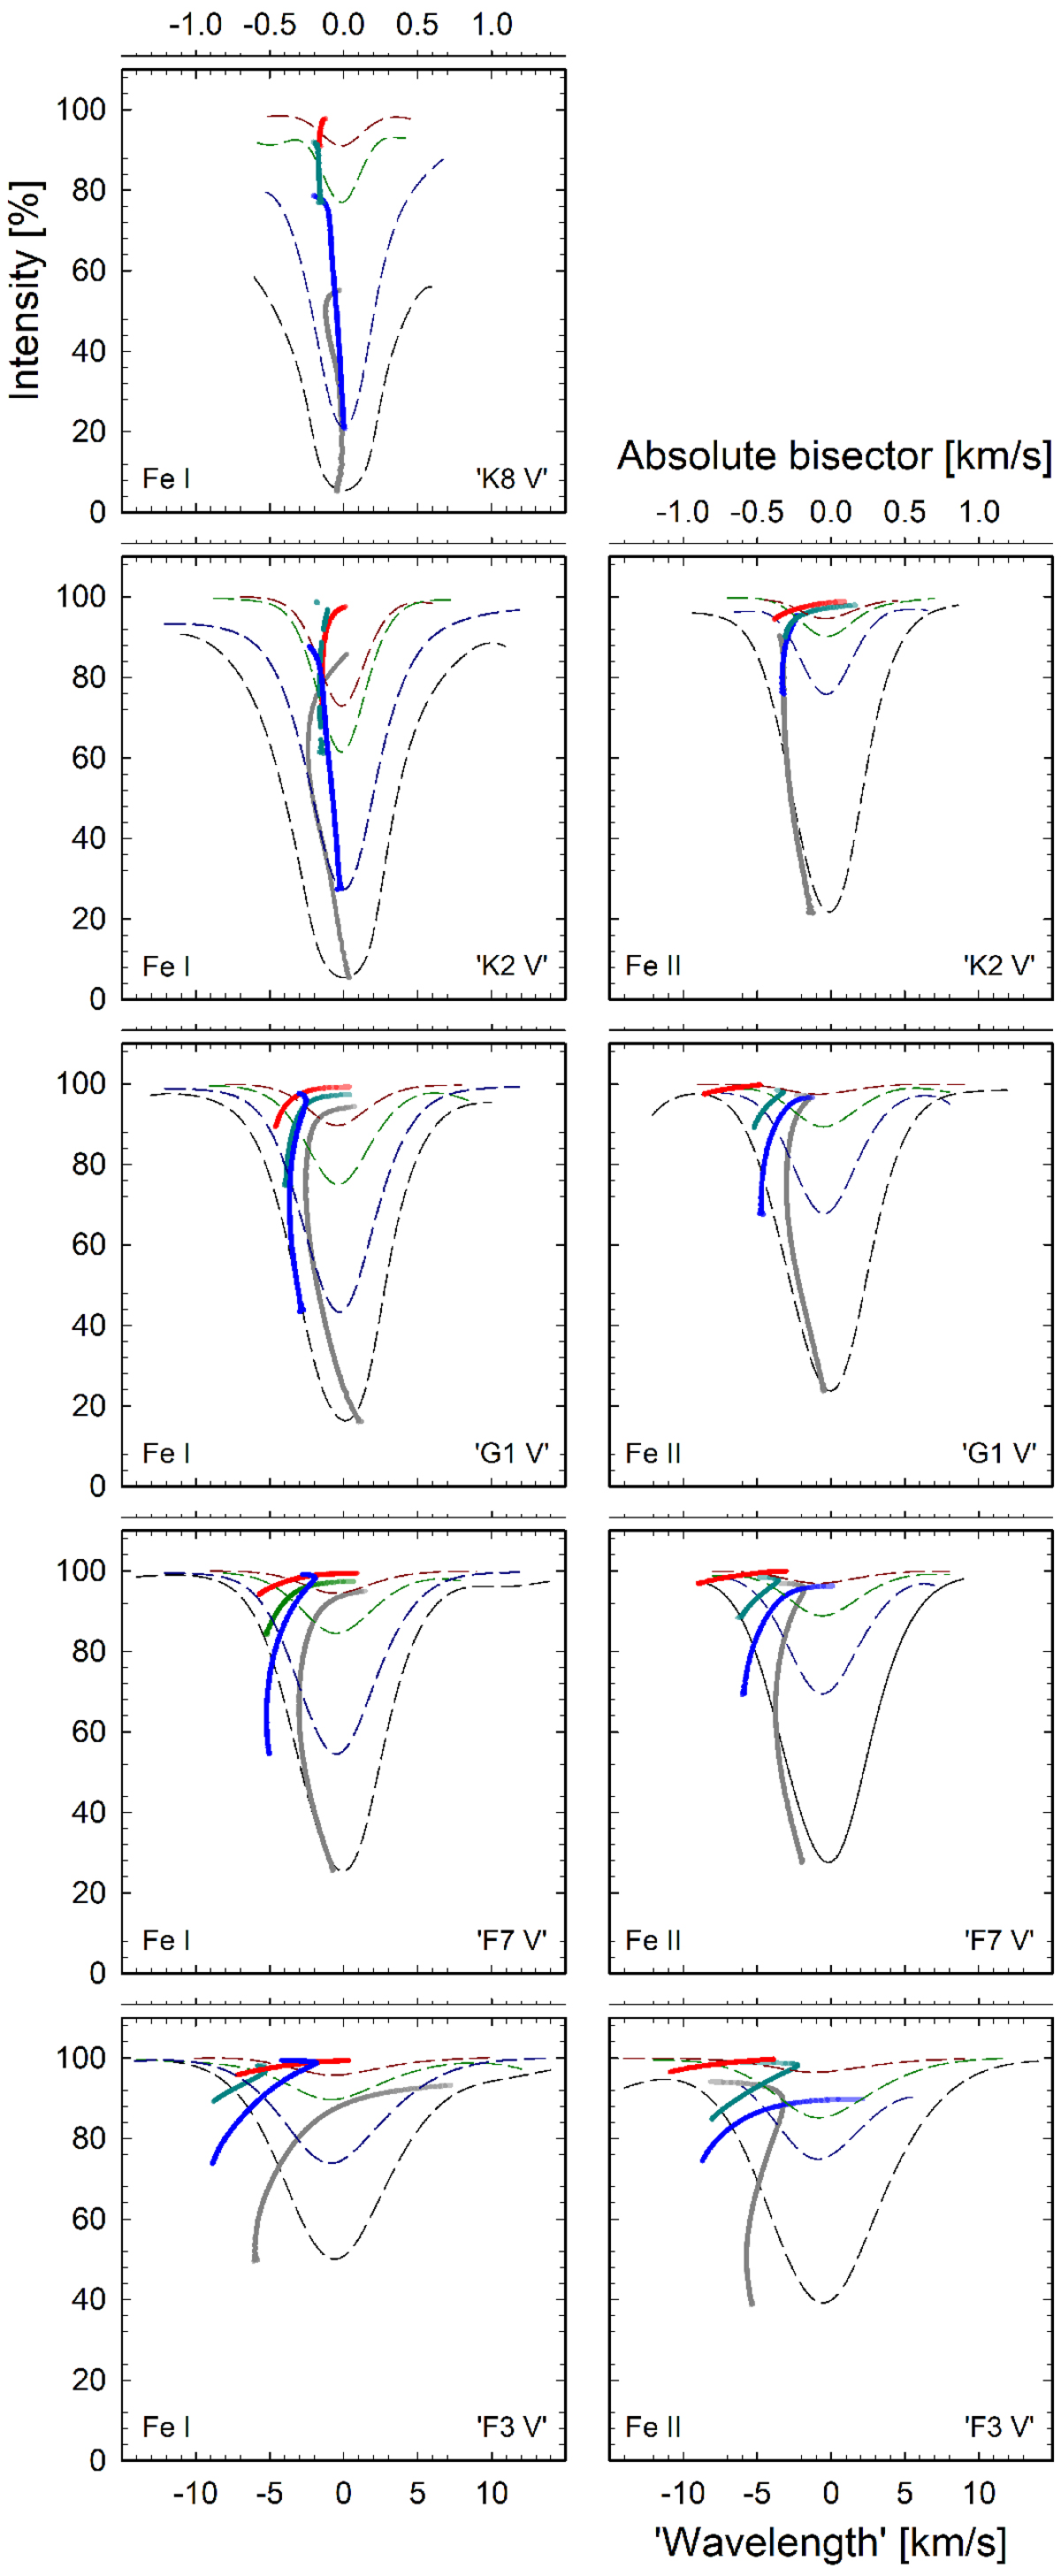
Bisectors (tenfold expanded top axes) and profiles (bottom) for differently strong Fe I (left column) and Fe II lines (right) in the flux from the full stellar disks for five different stellar models. Temperatures increase top down for the models ‘K8 V’, ‘K2 V’, ‘G1 V’, ‘F7 V’, and ‘F3 V’. Stellar rotation is zero, gravitational redshifts are neglected. For the coolest model, only lines from Fe I were well measurable. Continuum intensity scale is that of the overall stellar spectrum; in crowded spectra of the coolest models, not all lines reach the full continuum.
Current usage metrics show cumulative count of Article Views (full-text article views including HTML views, PDF and ePub downloads, according to the available data) and Abstracts Views on Vision4Press platform.
Data correspond to usage on the plateform after 2015. The current usage metrics is available 48-96 hours after online publication and is updated daily on week days.
Initial download of the metrics may take a while.