Fig. 4
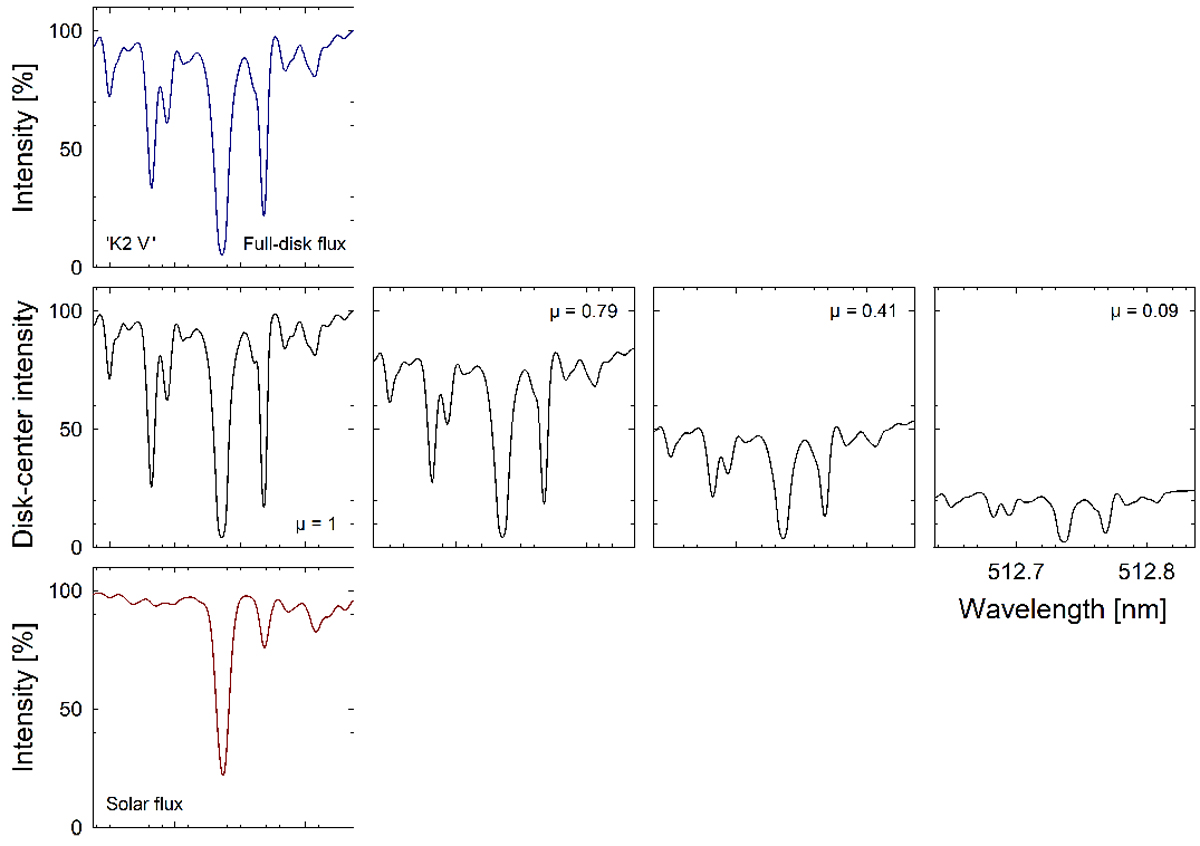
Example of a selected line from the ‘K2 V’ model (very strong Fe I, low excitation potential, λ 512.737 nm). Besides the changing profiles at different stellar disk positions, the top frame shows the synthetic full-disk flux, and the bottom frame – as a reference – the same line in a high-resolution solar flux spectrum atlas (Kurucz et al. 1984).
Current usage metrics show cumulative count of Article Views (full-text article views including HTML views, PDF and ePub downloads, according to the available data) and Abstracts Views on Vision4Press platform.
Data correspond to usage on the plateform after 2015. The current usage metrics is available 48-96 hours after online publication and is updated daily on week days.
Initial download of the metrics may take a while.