Fig. 3
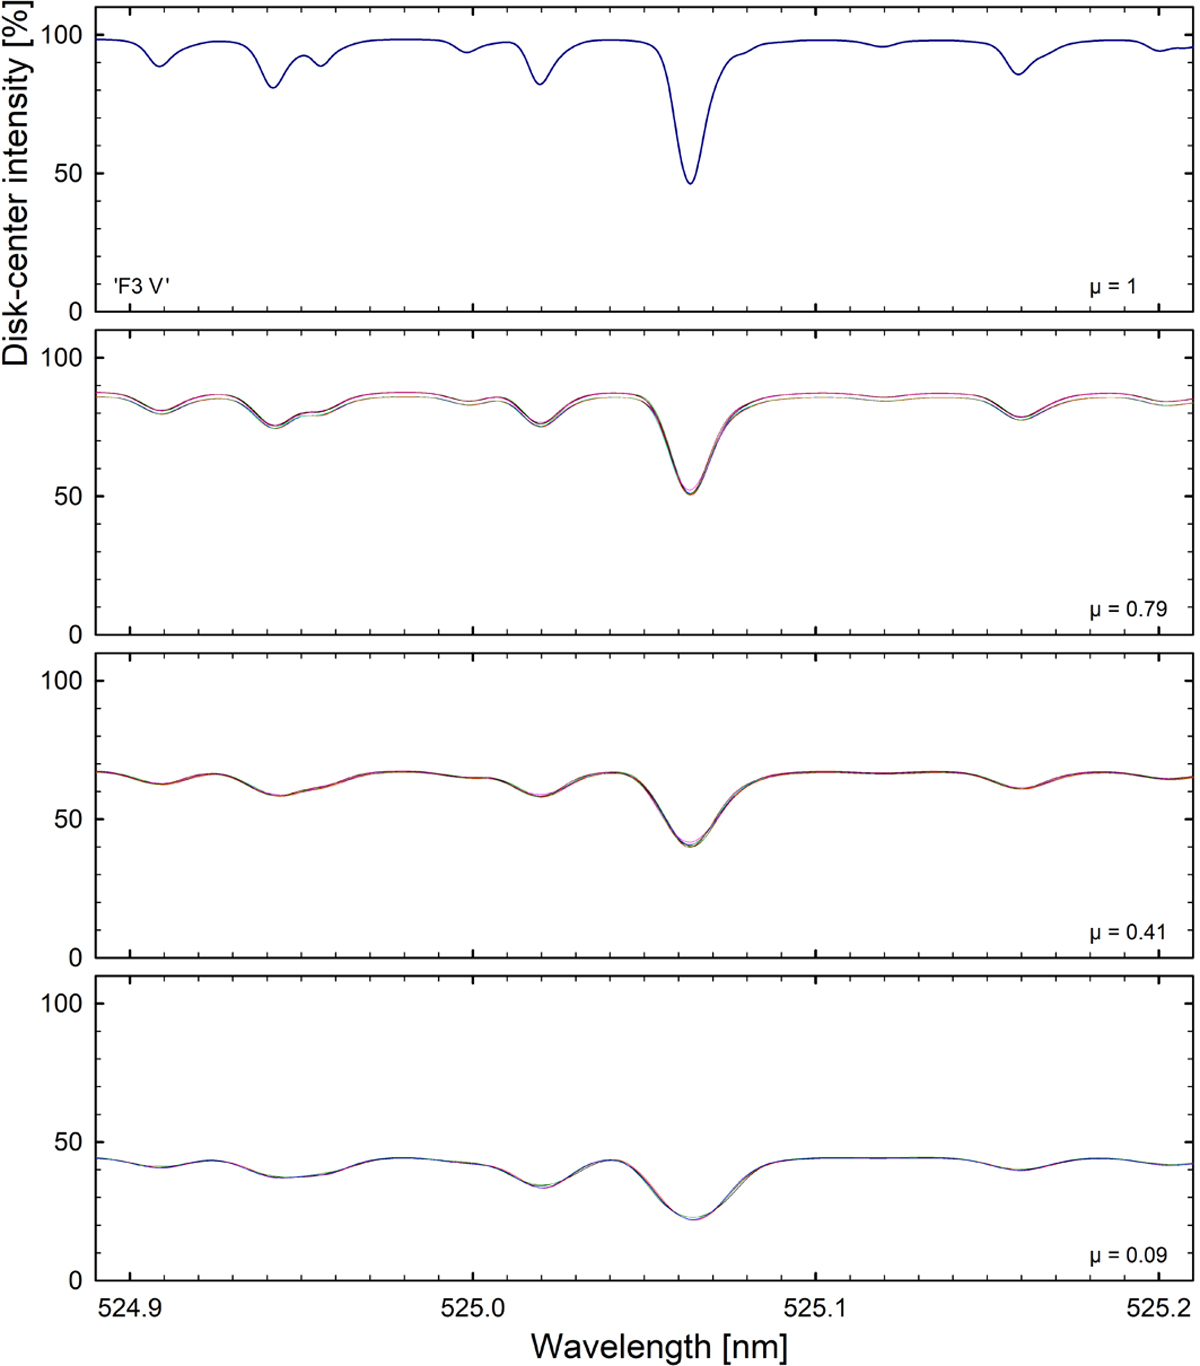
Synthetic spectra in a narrow spectral segment, from stellar disk center (top frame, μ = 1) to near the limb for the ‘F3 V’ model at Teff = 6726 K. For off-center positions, spectra from different azimuth angles are plotted, illustrating the variation across steps of 45° or 90° in azimuth. To see those subtle differences, this figure should be viewed highly magnified.
Current usage metrics show cumulative count of Article Views (full-text article views including HTML views, PDF and ePub downloads, according to the available data) and Abstracts Views on Vision4Press platform.
Data correspond to usage on the plateform after 2015. The current usage metrics is available 48-96 hours after online publication and is updated daily on week days.
Initial download of the metrics may take a while.