Fig. 10
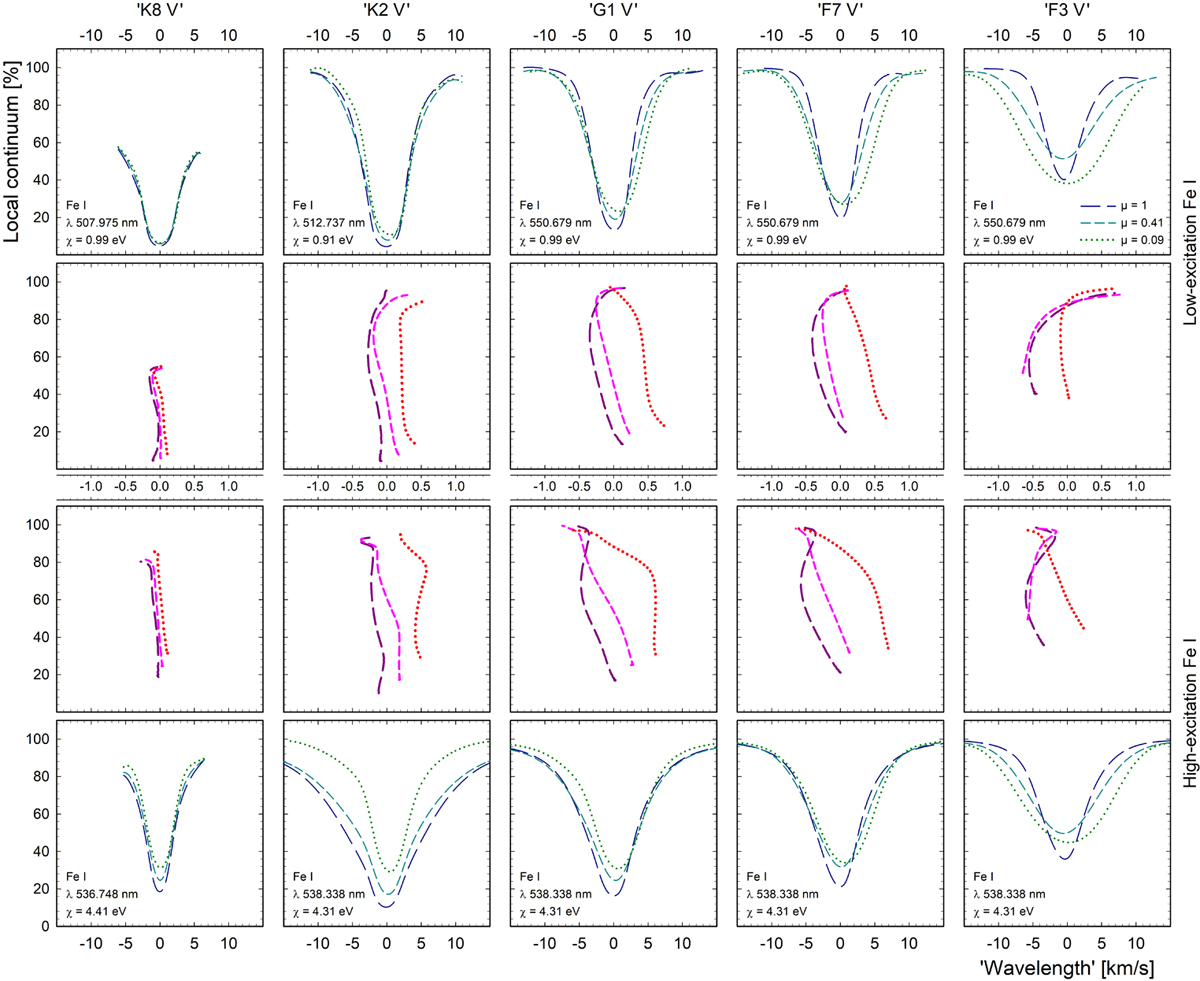
Dependence on excitation potential for Fe I lines of similar strength in five different models. Left to right: ‘K8 V’. ‘K2 V’, ‘G1 V’, ‘F7 V’, and ‘F3 V’. Low-excitation profiles and bisectors are indicated in the top rows, high-excitation ones atbottom. Long-dashed profiles and bisectors are shown for stellar disk-center positions μ = 1; short-dashed for μ = 0.41, and dotted for μ = 0.09. Bisector scales (at center) are expanded tenfold relative to the line profiles.
Current usage metrics show cumulative count of Article Views (full-text article views including HTML views, PDF and ePub downloads, according to the available data) and Abstracts Views on Vision4Press platform.
Data correspond to usage on the plateform after 2015. The current usage metrics is available 48-96 hours after online publication and is updated daily on week days.
Initial download of the metrics may take a while.