Fig. 2
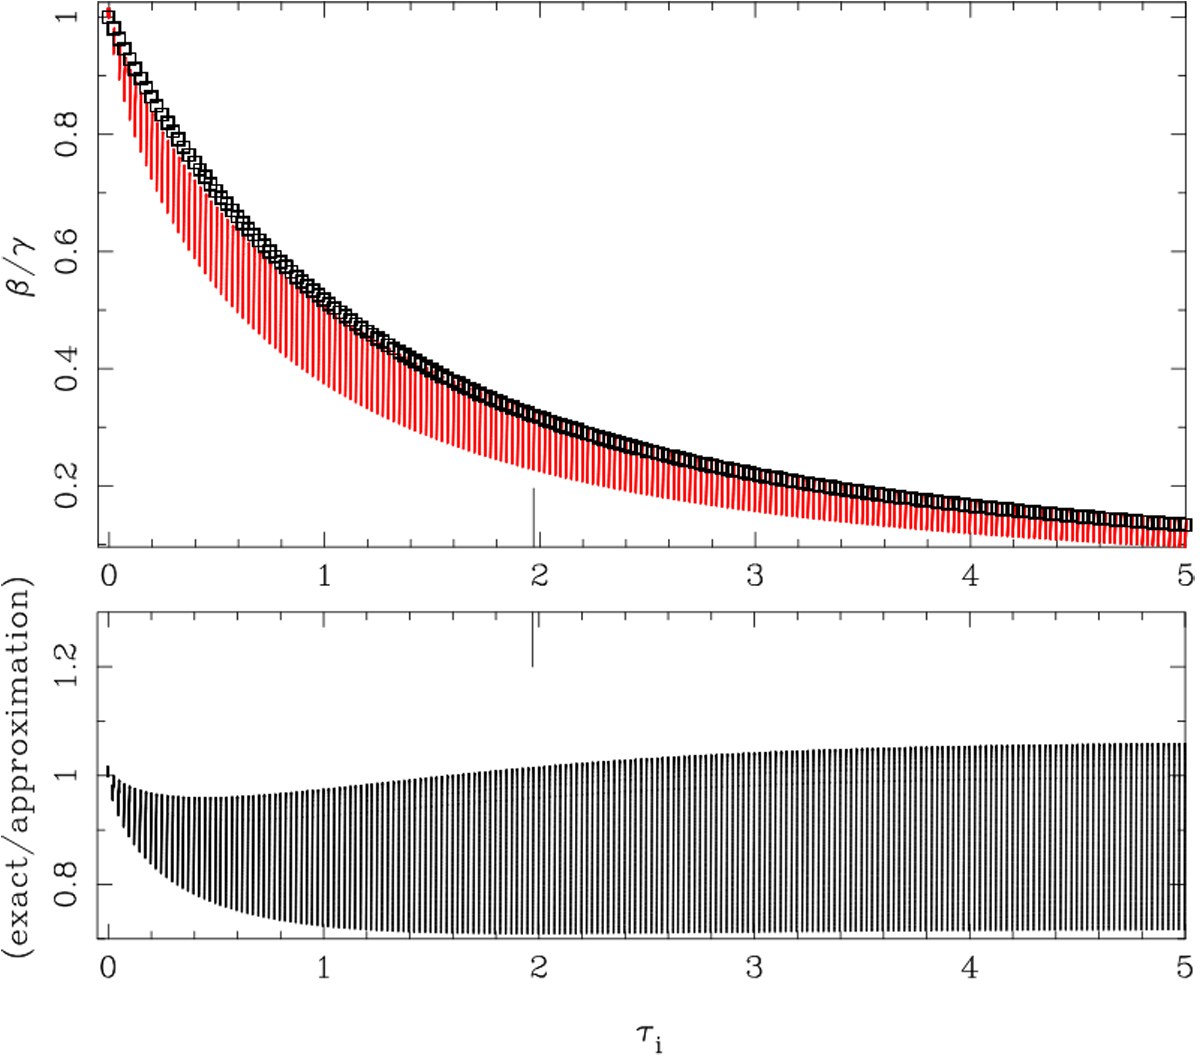
Ratio of β over γ plotted against the line optical depth for the approximation in MJ83: Eqs. (3) and (5) with α = 1.5 and Δ = 0 and calculated for τc < 5. The approximation is plotted with small squares in the upper panel. The ratio of the exact solution to the assumed approximation is shown in the bottom panel. For each discrete value of τi (calculated at 0.025 intervals), the vertical lines indicate the range in the continuum optical depth, from 0 (largest value of β/γ) to the maximum value (lowest value). The small vertical lines at the bottom of the upper panel and at the top of the bottom panel indicate the optical depth where the difference between the exact calculation and the approximation is largest.
Current usage metrics show cumulative count of Article Views (full-text article views including HTML views, PDF and ePub downloads, according to the available data) and Abstracts Views on Vision4Press platform.
Data correspond to usage on the plateform after 2015. The current usage metrics is available 48-96 hours after online publication and is updated daily on week days.
Initial download of the metrics may take a while.