Free Access
Fig. 4.
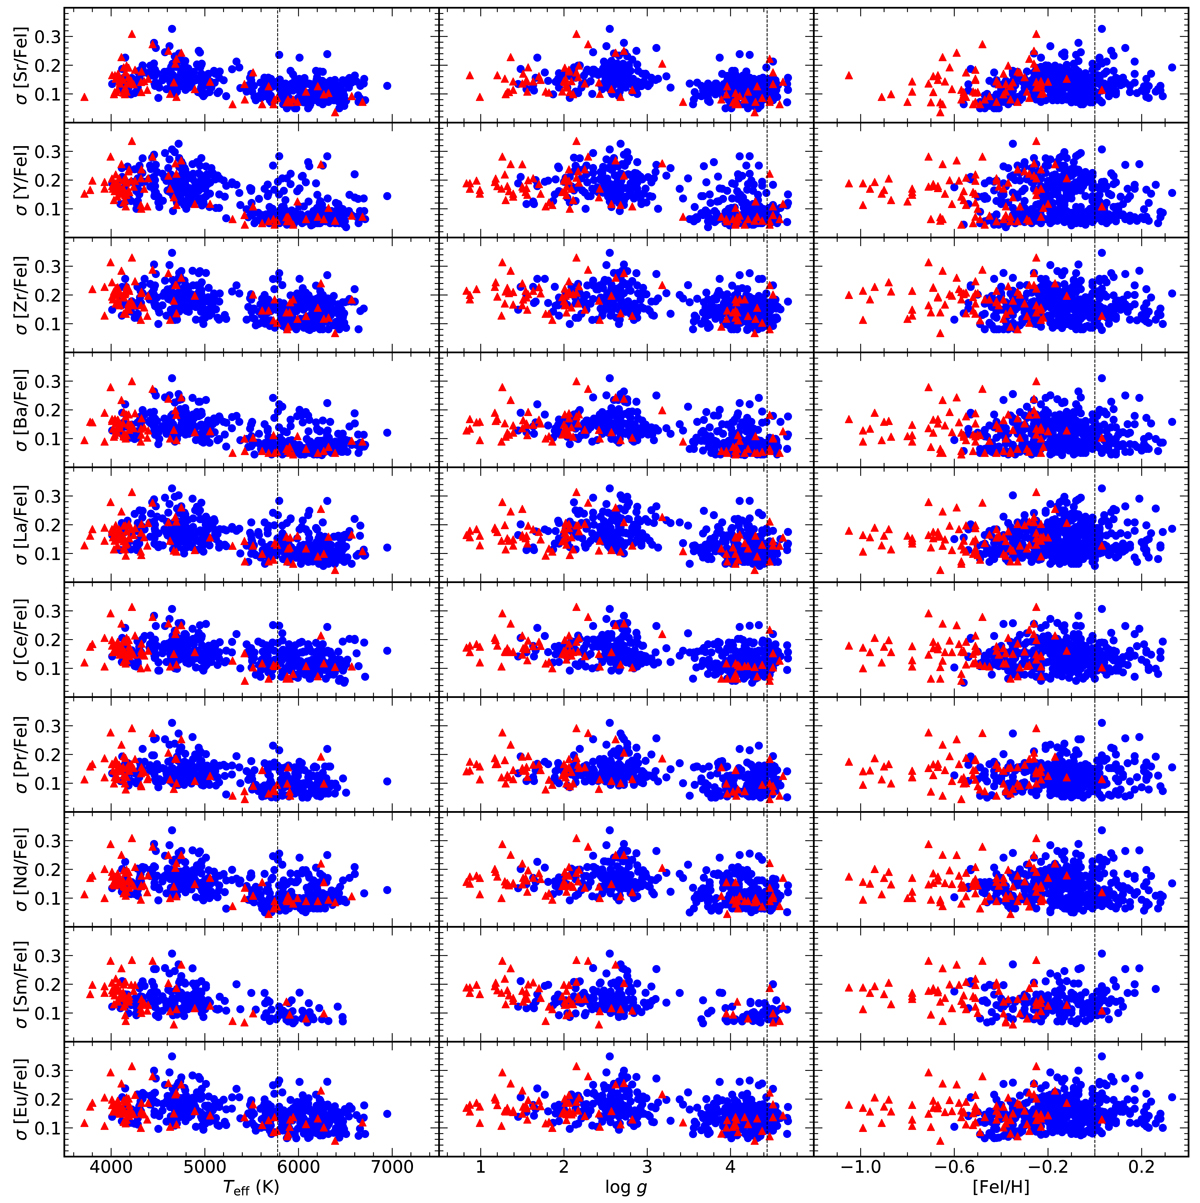
Uncertainties on the abundance ratios as a function of Teff, log g, and [Fe/H]. The blue dots represent the thin-disc and the red triangles represent the thick-disc stars. See Sect. 2.5 for details of how the uncertainties have been evaluated.
Current usage metrics show cumulative count of Article Views (full-text article views including HTML views, PDF and ePub downloads, according to the available data) and Abstracts Views on Vision4Press platform.
Data correspond to usage on the plateform after 2015. The current usage metrics is available 48-96 hours after online publication and is updated daily on week days.
Initial download of the metrics may take a while.