Fig. 17.
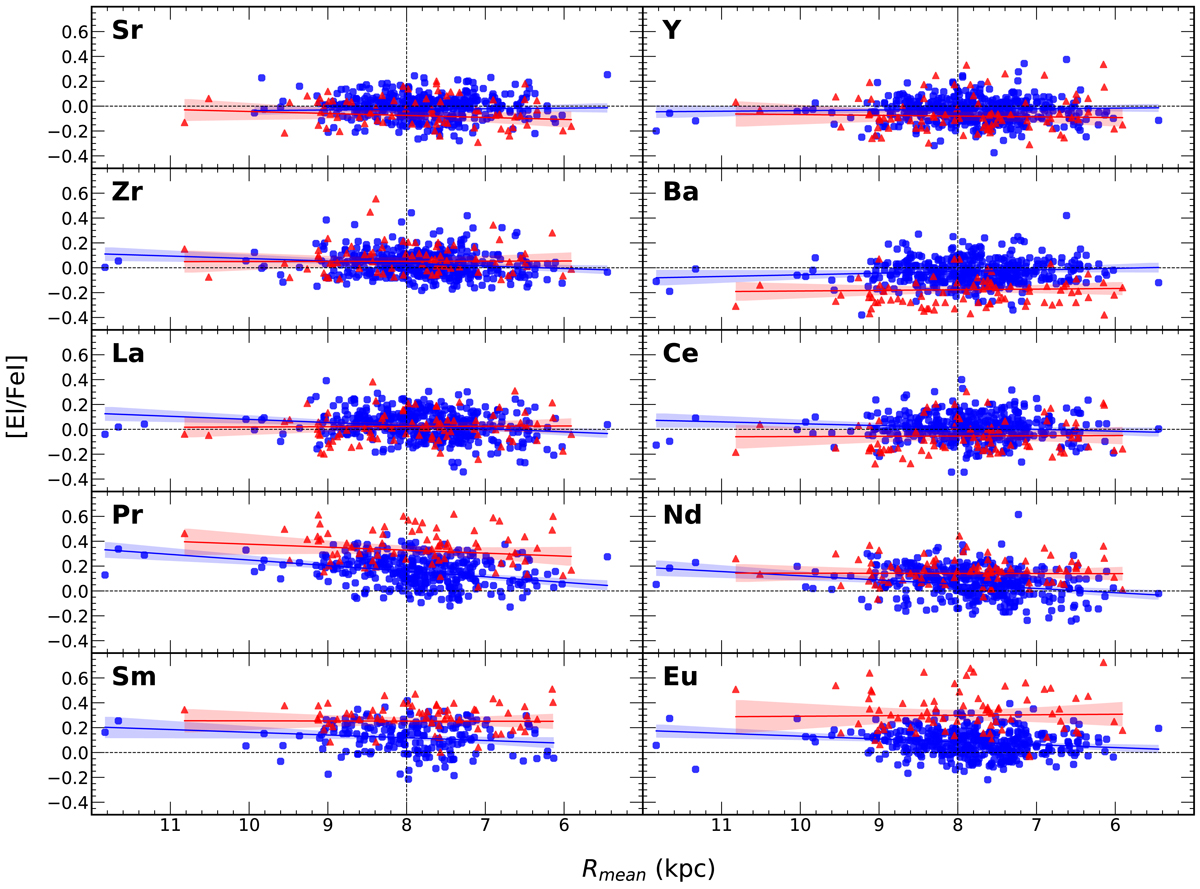
Elemental-to-iron abundance ratios as a function of the mean galactocentric distances. The blue dots and red triangles represent the thin- and thick-disc stars of our study, respectively. The blue lines are the linear fits for the thin-disc stars and the red lines show the thick-disc stars. The uncertainties in [El/Fe] and Rmean were taken into account while computing the slopes. The 95% confidence intervals for the slopes are shadowed. The dotted lines correspond to the solar mean galactocentric distance.
Current usage metrics show cumulative count of Article Views (full-text article views including HTML views, PDF and ePub downloads, according to the available data) and Abstracts Views on Vision4Press platform.
Data correspond to usage on the plateform after 2015. The current usage metrics is available 48-96 hours after online publication and is updated daily on week days.
Initial download of the metrics may take a while.