Fig. 16.
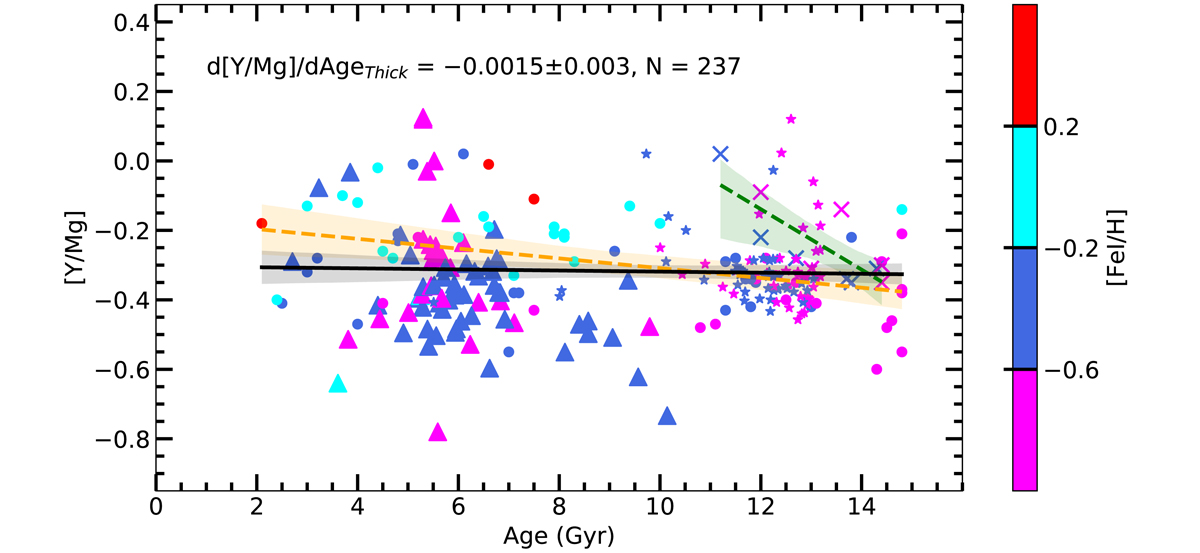
[Y/Mg] of the thick-disc stars colour-coded by metallicity as a function of age. Our sample stars (triangles) are suplemented by data from Bensby et al. (2014) (dots), Delgado Mena et al. (2018) and Adibekyan et al. (2012) (stars), and Titarenko et al. (2019) (crosses). The black continuous line is a fit to the entire sample of 237 stars. For a comparison, the dashed green line represents the trend taken from Titarenko et al. (2019), who computed it for the AMBRE sample of 11 thick-disc stars; and the dashed yellow line represents the trend that we computed using Bensby et al. (2014) data alone covering the entire investigated age interval. The shadowed areas show the 95% confidence interval for the ordinary least-squares regressions.
Current usage metrics show cumulative count of Article Views (full-text article views including HTML views, PDF and ePub downloads, according to the available data) and Abstracts Views on Vision4Press platform.
Data correspond to usage on the plateform after 2015. The current usage metrics is available 48-96 hours after online publication and is updated daily on week days.
Initial download of the metrics may take a while.