Fig. 11.
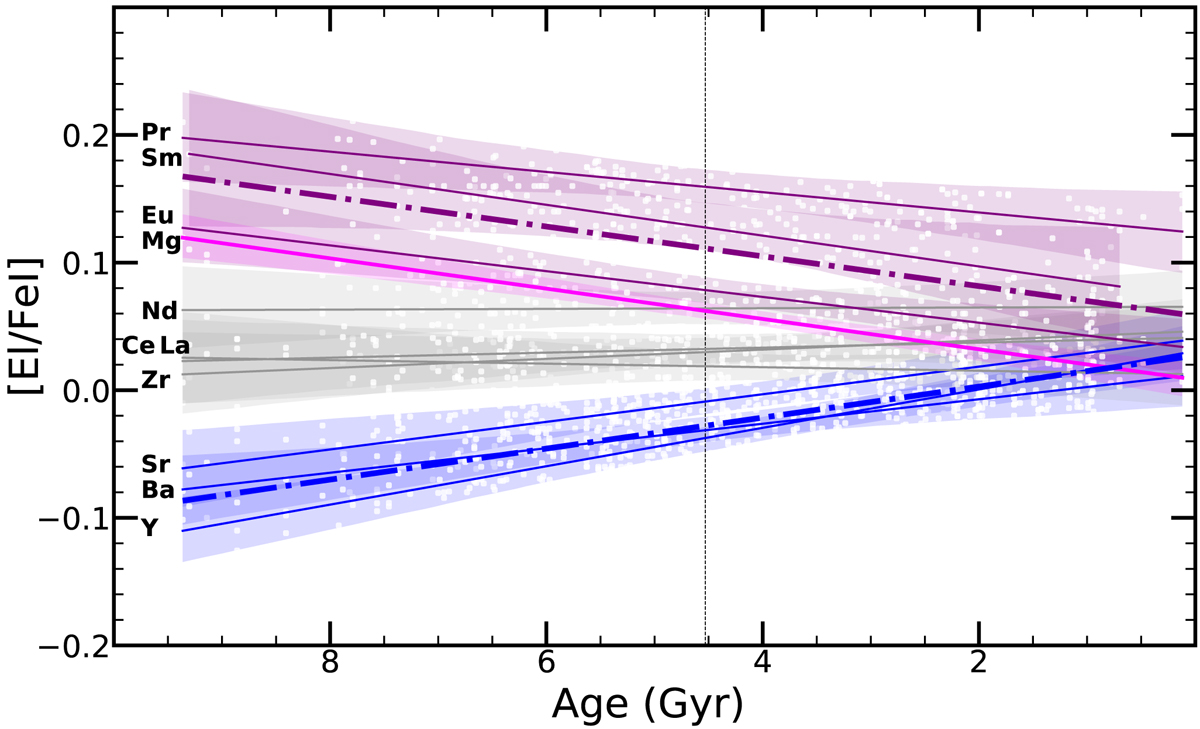
Compilation of [El/Fe I] trends as a function of age for the thin-disc stars. The continuous purple lines represent the r-process dominated elements Eu, Sm, and Pr. The thick dash-dotted line is an averaged trend of these element-to-iron abundance ratios. The continuous blue lines represent the s-process dominated elements Y, Sr, and Ba. The thick dash-dotted line is an averaged trend of these element-to-iron abundance ratios. The grey continuous lines are for elements with negligible [El/Fe I] age trends (Nd, Ce, La, and Zr). The continuous magenta line represents the [Mg/Fe I] age correlation. The shadowed areas show the 95% confidence interval for the regressions. The vertical dashed line marks the solar age.
Current usage metrics show cumulative count of Article Views (full-text article views including HTML views, PDF and ePub downloads, according to the available data) and Abstracts Views on Vision4Press platform.
Data correspond to usage on the plateform after 2015. The current usage metrics is available 48-96 hours after online publication and is updated daily on week days.
Initial download of the metrics may take a while.