Fig. 10.
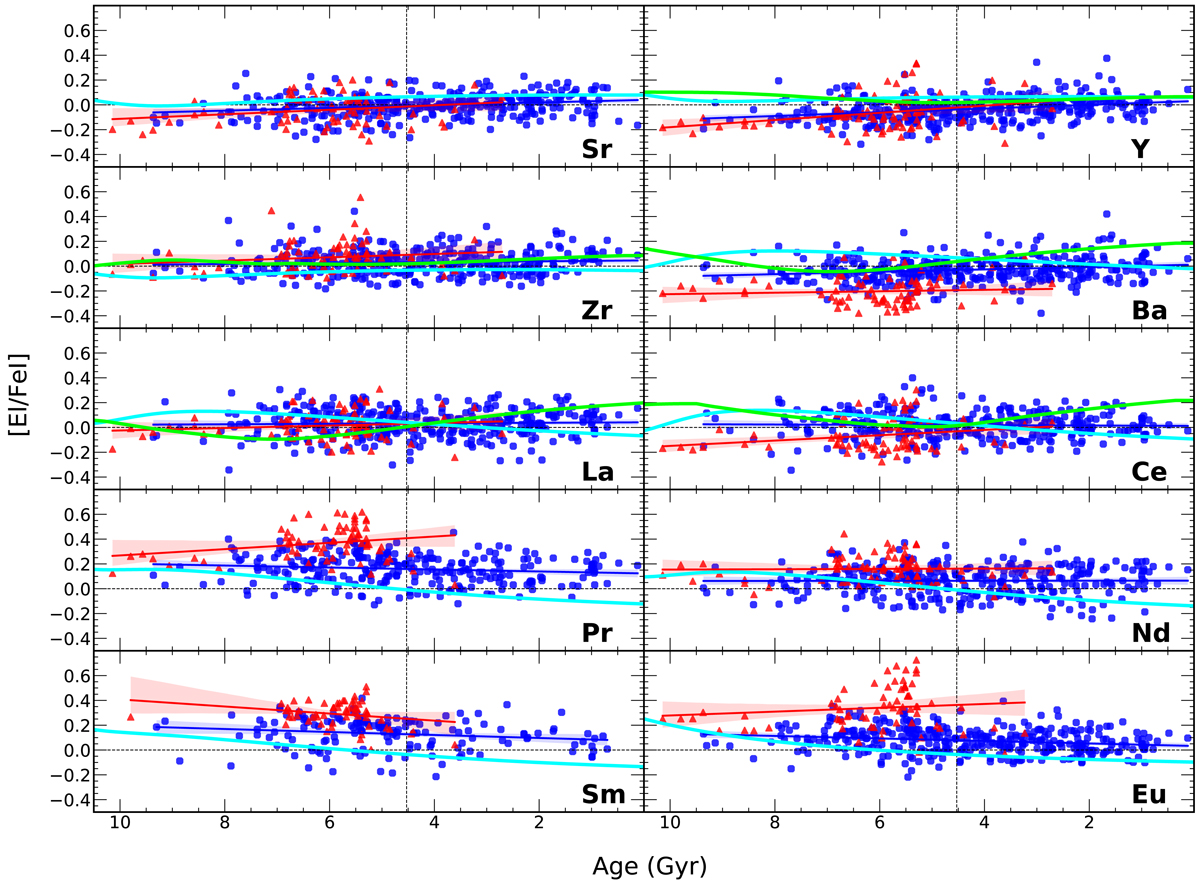
Elemental-to-iron abundance ratios as a function of age. The blue dots and red triangles represent the thin- and thick-disc stars of our study, respectively. The green lines represent the models by Maiorca et al. (2012) and the cyan lines those by Prantzos et al. (2018). The blue lines are the linear fits for the thin-disc stars of this work and the red lines show the thick-disc stars, with a 95% confidence interval for the ordinary least-squares regressions. The vertical dashed lines indicate the adopted age of the Sun (4.53 Gyr).
Current usage metrics show cumulative count of Article Views (full-text article views including HTML views, PDF and ePub downloads, according to the available data) and Abstracts Views on Vision4Press platform.
Data correspond to usage on the plateform after 2015. The current usage metrics is available 48-96 hours after online publication and is updated daily on week days.
Initial download of the metrics may take a while.