Fig. 15
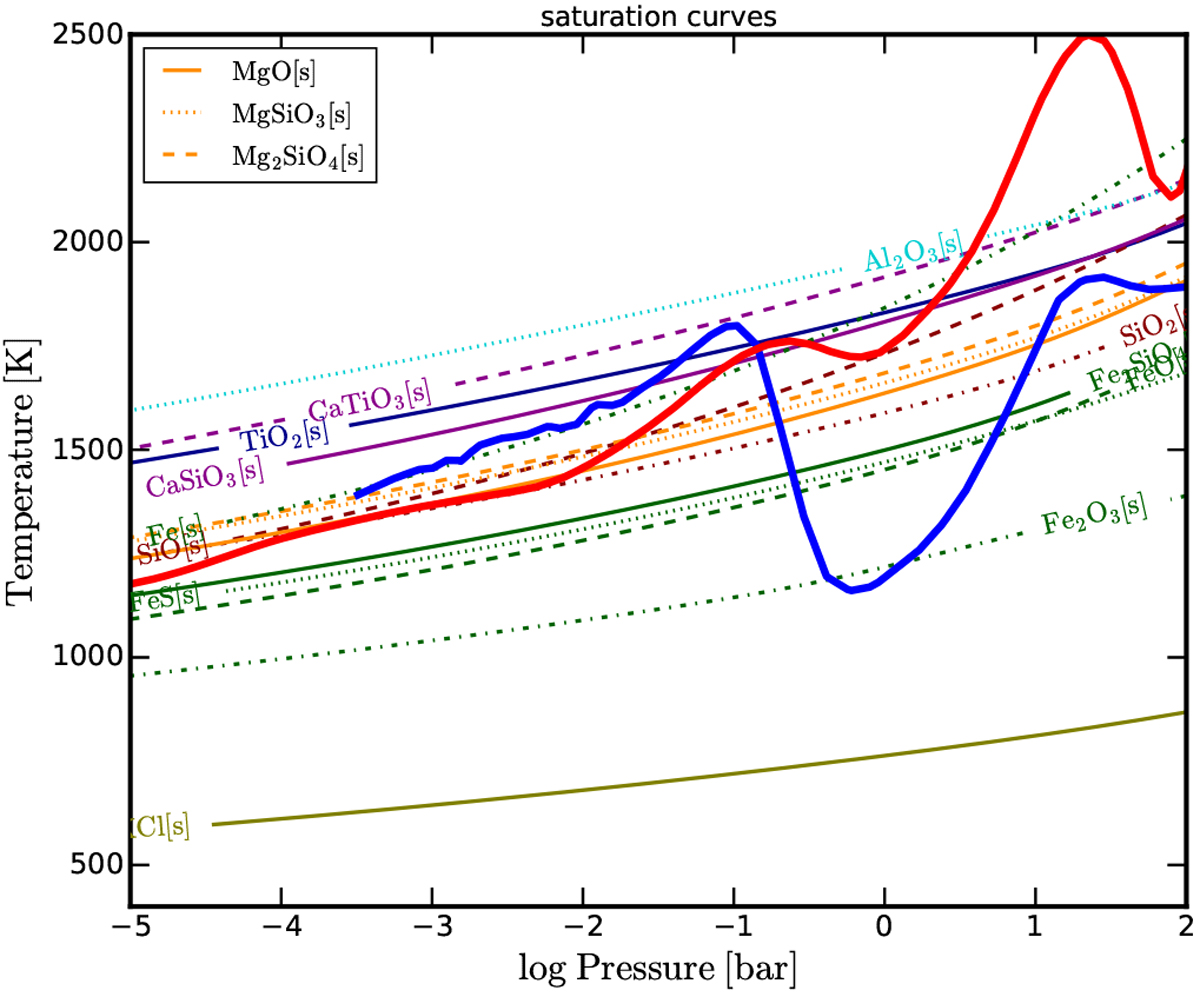
Sub-stellar (Tgas, pgas)-profiles from the Carone (blue, extended inner boundary) and the Parmentier (red, standard inner boundary) GCM runs for WASP-43b. The comparison to the thermal stability curves (supersaturation ratio S = 1 for solar element abundances) of selected solid materials shows that the local temperature differences at pgas ≈ 1 bar support our finding for the cloud particle material composition differences between the two models (Fig. 14). We note that the S = 1 curves do not represent our full kinetic model approach and are provided here for the purpose of visualisation.
Current usage metrics show cumulative count of Article Views (full-text article views including HTML views, PDF and ePub downloads, according to the available data) and Abstracts Views on Vision4Press platform.
Data correspond to usage on the plateform after 2015. The current usage metrics is available 48-96 hours after online publication and is updated daily on week days.
Initial download of the metrics may take a while.