Fig. 9.
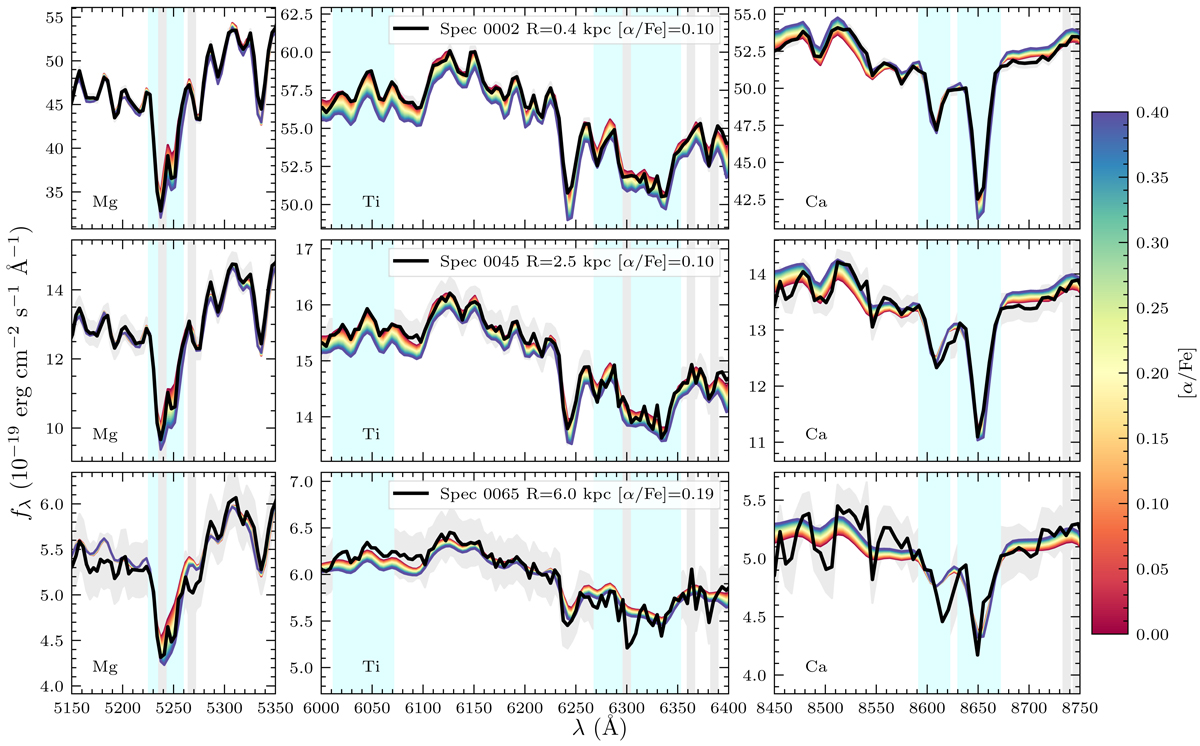
Zoom-in around three α sensitive absorption-features which are dominated by three different elements: Mg (left panels), Ti (middle panels), and Ca (right panels). Blue shaded regions highlight the bandpass of the indices often measured around these features (Mgb, TiO1, TiO2, Ca1, Ca2), while gray vertical lines are regions contaminated by sky and telluric lines and therefore masked out from the fit. From the top to the bottom panel, we plot three NGC 3311 spectra in black, with a common resolution of 200 km s−1 pixel−1 and increasing distance from the center, as specified in the caption. Colored lines are instead MILES SSP models with fixed age, metallicity, [Na/Fe], and IMF, and color-coded by [α/Fe] (red solar and blue 0.4, as highlighted by the color bar on the side). The figure demonstrates that the only slightly super solar [α/Fe] (∼0.1) inferred from the fit for the central core is a combination of a larger [Mg/Fe] plus roughly solar [Ti/Fe] and [Ca/Fe]. This explains the apparent disagreement between the [α/Fe] obtained here via full spectral fitting and that obtained in B16 using line indices, which is, in reality, a [Mg/Fe] ratio because it was computed from the Mgb and Fe lines only.
Current usage metrics show cumulative count of Article Views (full-text article views including HTML views, PDF and ePub downloads, according to the available data) and Abstracts Views on Vision4Press platform.
Data correspond to usage on the plateform after 2015. The current usage metrics is available 48-96 hours after online publication and is updated daily on week days.
Initial download of the metrics may take a while.