Fig. 7.
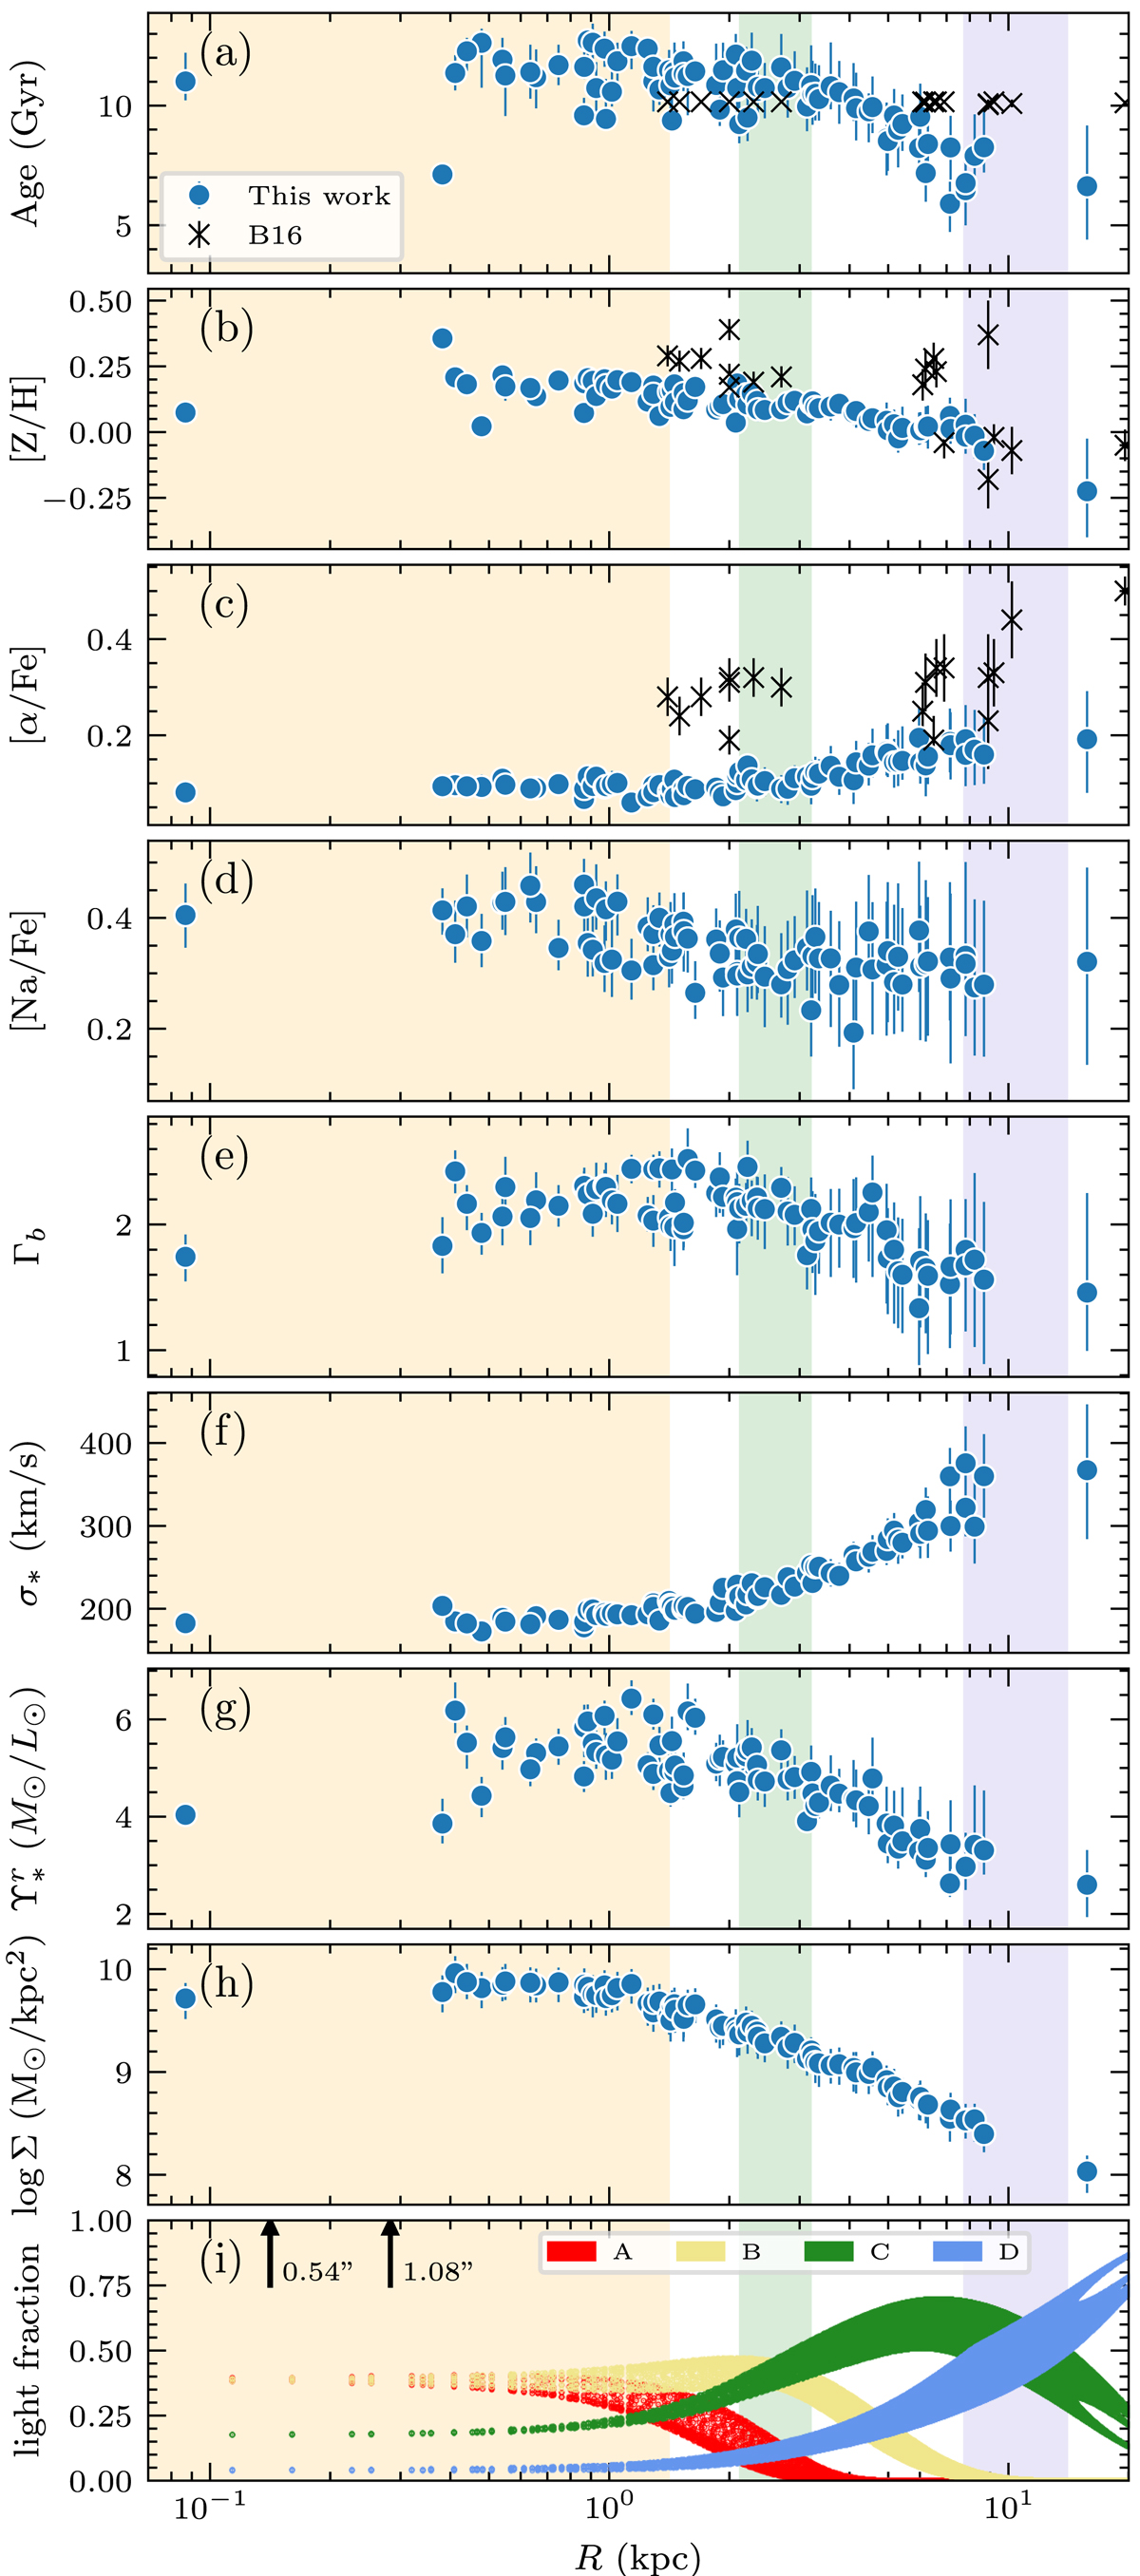
Radial profiles of the age (a), metallicity (b), [α/Fe] (c), [Na/Fe] (d), IMF slope (e), velocity dispersion (f), r-band mass-to-light ratio (g), and stellar surface density (h) in NGC 3311. Black crosses in the three top panels show the results from previous FORS2 slitlets data (B16). The bottom panel (i) shows the fraction of light for each substructure as determined from the photometric decomposition in B18. The orange shaded area indicates the region where the compact progenitor contributes significantly to the light budget, while the green and blue vertical shades indicate the transition region between dominant subcomponents B to C, and C to D. The vertical arrows in panel i indicate apertures with 1× and 2× the seeing radius (FWHM/2). We note that the x-axis is on log-scale.
Current usage metrics show cumulative count of Article Views (full-text article views including HTML views, PDF and ePub downloads, according to the available data) and Abstracts Views on Vision4Press platform.
Data correspond to usage on the plateform after 2015. The current usage metrics is available 48-96 hours after online publication and is updated daily on week days.
Initial download of the metrics may take a while.