Fig. 4.
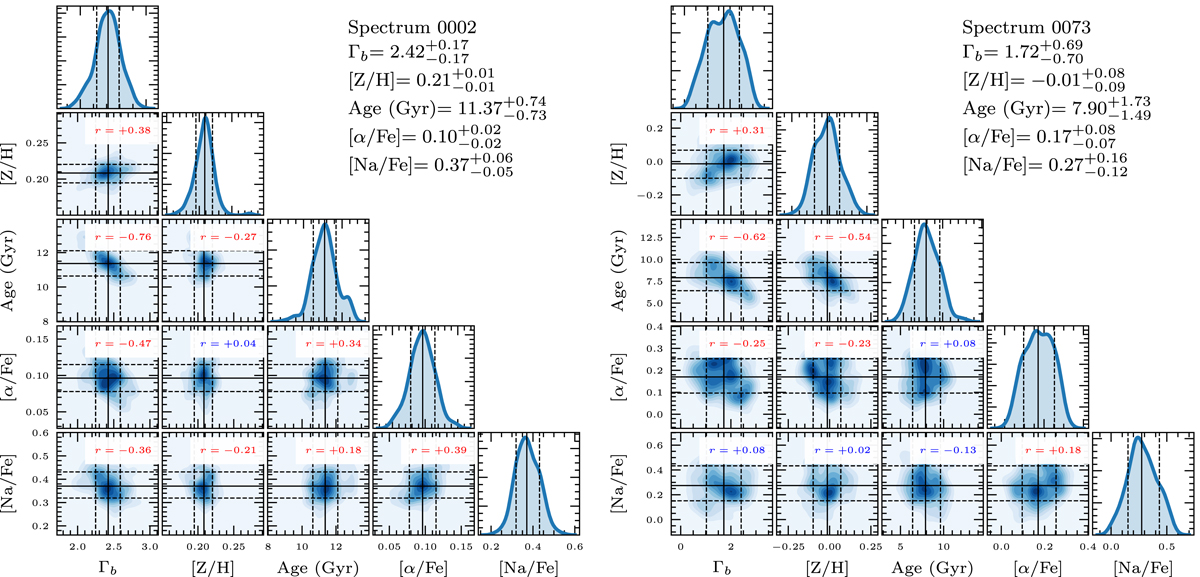
Examples of corner plots for the same two spectra as in Fig. 3. The diagonal histograms indicate the marginalized posterior samples used for inference, while the density maps below them represent projections of the marginalized posterior distribution. Solid lines indicate the median value used as a reference, and the dashed lines indicate the 16% and 84% percentiles used to estimate the ±1σ uncertainties. The Pearson correlation coefficient r is indicated at the top of each panel under the diagonal, with red (blue) colors indicating a p-value smaller (larger) than 1%. A summary of the statistics for the stellar population parameters is displayed in the upper right part of each panel.
Current usage metrics show cumulative count of Article Views (full-text article views including HTML views, PDF and ePub downloads, according to the available data) and Abstracts Views on Vision4Press platform.
Data correspond to usage on the plateform after 2015. The current usage metrics is available 48-96 hours after online publication and is updated daily on week days.
Initial download of the metrics may take a while.