Fig. 7
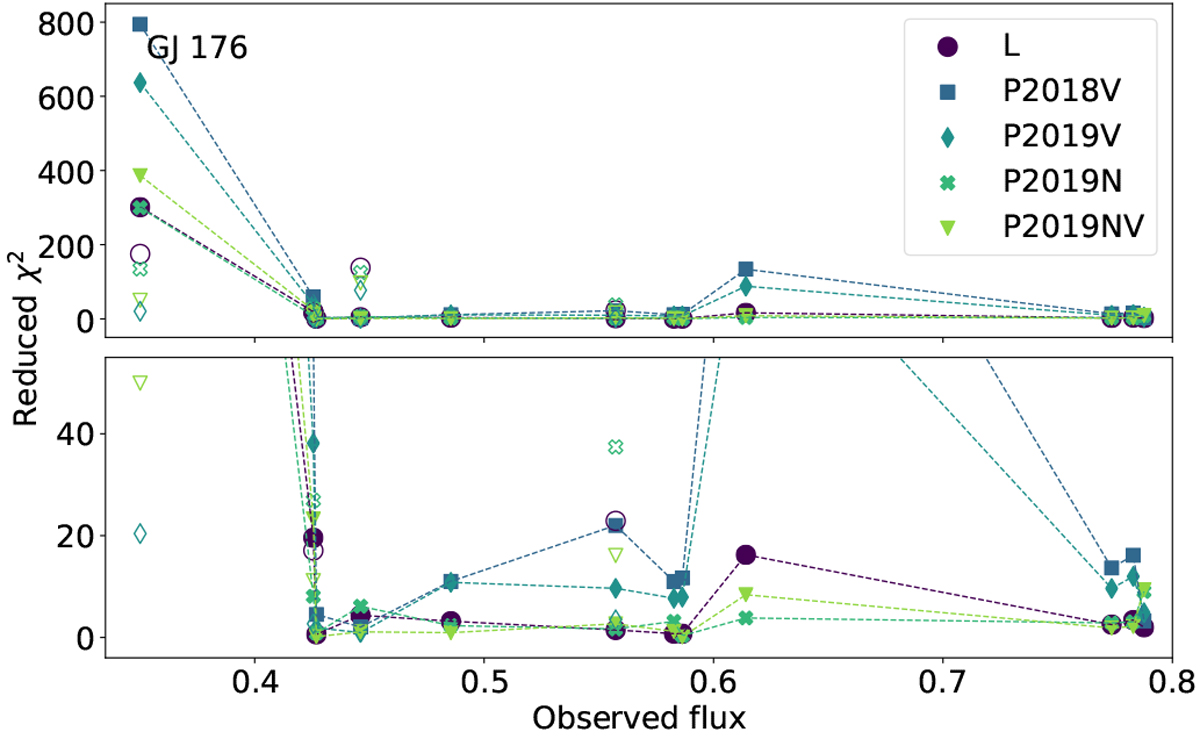
Reduced χ2 between the synthetic and observed spectra for the cores of the 12 strongest lines for the star GJ 176 as a function of the observed flux in the centre of the lines (filled symbols). The symbols are the same as in Fig. 2 and refer to the parameters used for the synthetic spectra. The upper panel shows the whole range of χ2 while the lower panel focuses on χ2 below 50. The open symbols indicate the χ2 of K lines generated in non-LTE for L2016 or L2017 and P2019. The identifications of all lines are presented in Table 5 together with the wavelengths and observed fluxes.
Current usage metrics show cumulative count of Article Views (full-text article views including HTML views, PDF and ePub downloads, according to the available data) and Abstracts Views on Vision4Press platform.
Data correspond to usage on the plateform after 2015. The current usage metrics is available 48-96 hours after online publication and is updated daily on week days.
Initial download of the metrics may take a while.