Free Access
Fig. 5
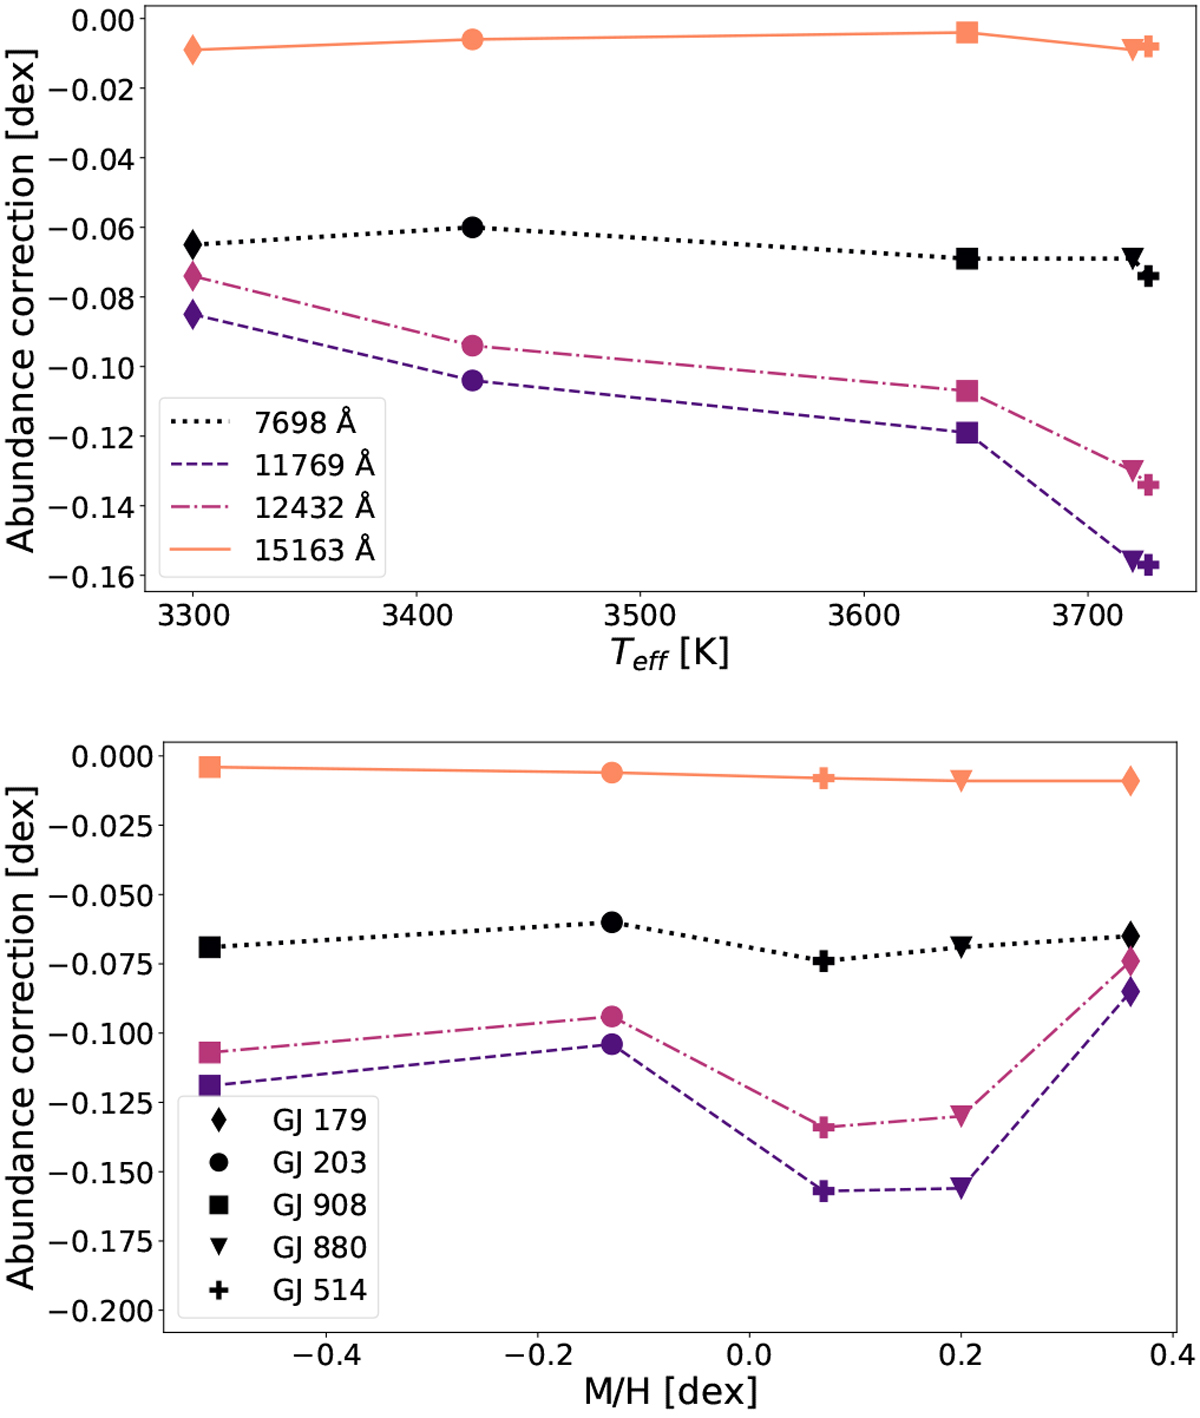
Abundance corrections for four different potassium lines from Table 3 versus effective temperature and metallicity for the stars in the table. The legend in the top panel shows the line styles used to indicate different spectral lines, and the legend in the lower panel shows the symbols used to indicate different stars.
Current usage metrics show cumulative count of Article Views (full-text article views including HTML views, PDF and ePub downloads, according to the available data) and Abstracts Views on Vision4Press platform.
Data correspond to usage on the plateform after 2015. The current usage metrics is available 48-96 hours after online publication and is updated daily on week days.
Initial download of the metrics may take a while.