Fig. 2
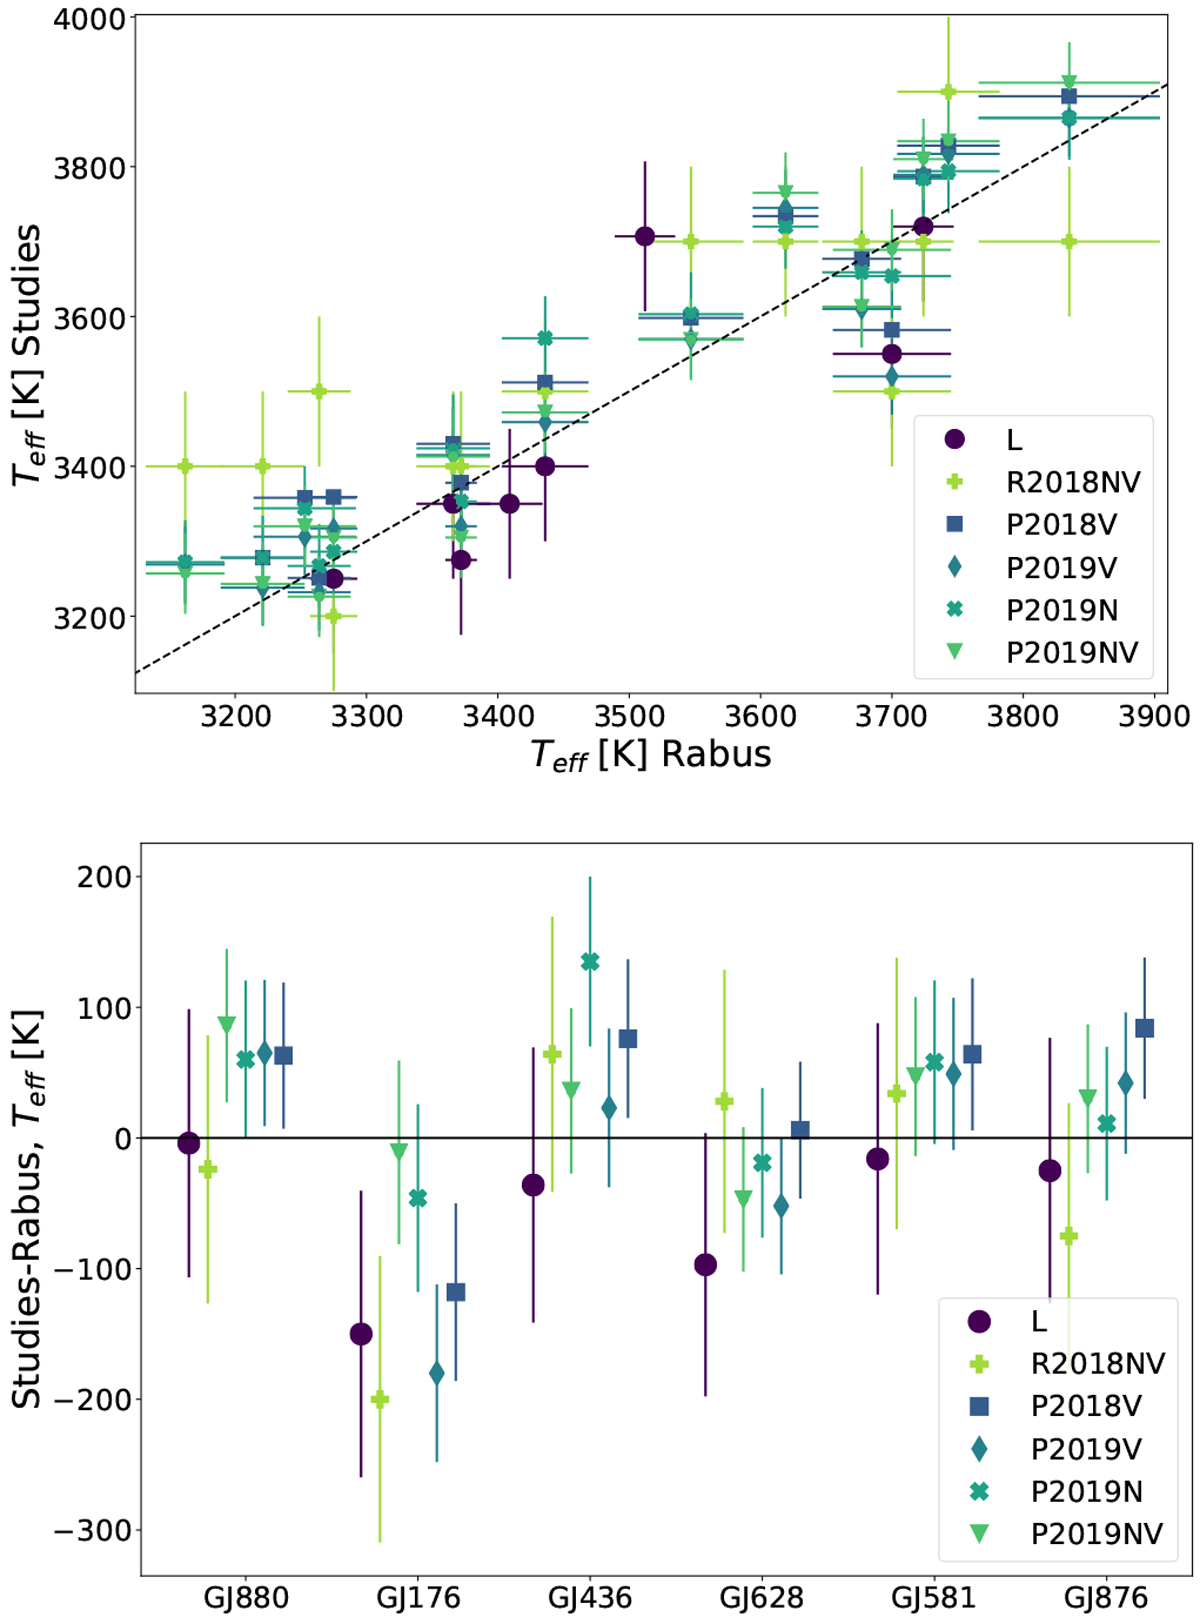
Top: effective temperatures for a sample of stars from Passegger et al. (P2018 and P2019), Rajpurohit et al. (R2018), and/or Lindgren et al. (L2016 or L2017, designated L) that overlaps with the sample from Rabus et al. (2019). Bottom: difference ineffective temperature for the six stars in common between Lindgren et al., Passegger et al., Rajpurohit et al., and Rabus et al. (2019). The temperature from Rabus et al. (2019) was subtracted from the others. The error bars indicate the combined uncertainties. V, N, and NV have the same meaning as in Fig. 1.
Current usage metrics show cumulative count of Article Views (full-text article views including HTML views, PDF and ePub downloads, according to the available data) and Abstracts Views on Vision4Press platform.
Data correspond to usage on the plateform after 2015. The current usage metrics is available 48-96 hours after online publication and is updated daily on week days.
Initial download of the metrics may take a while.