Fig. 11
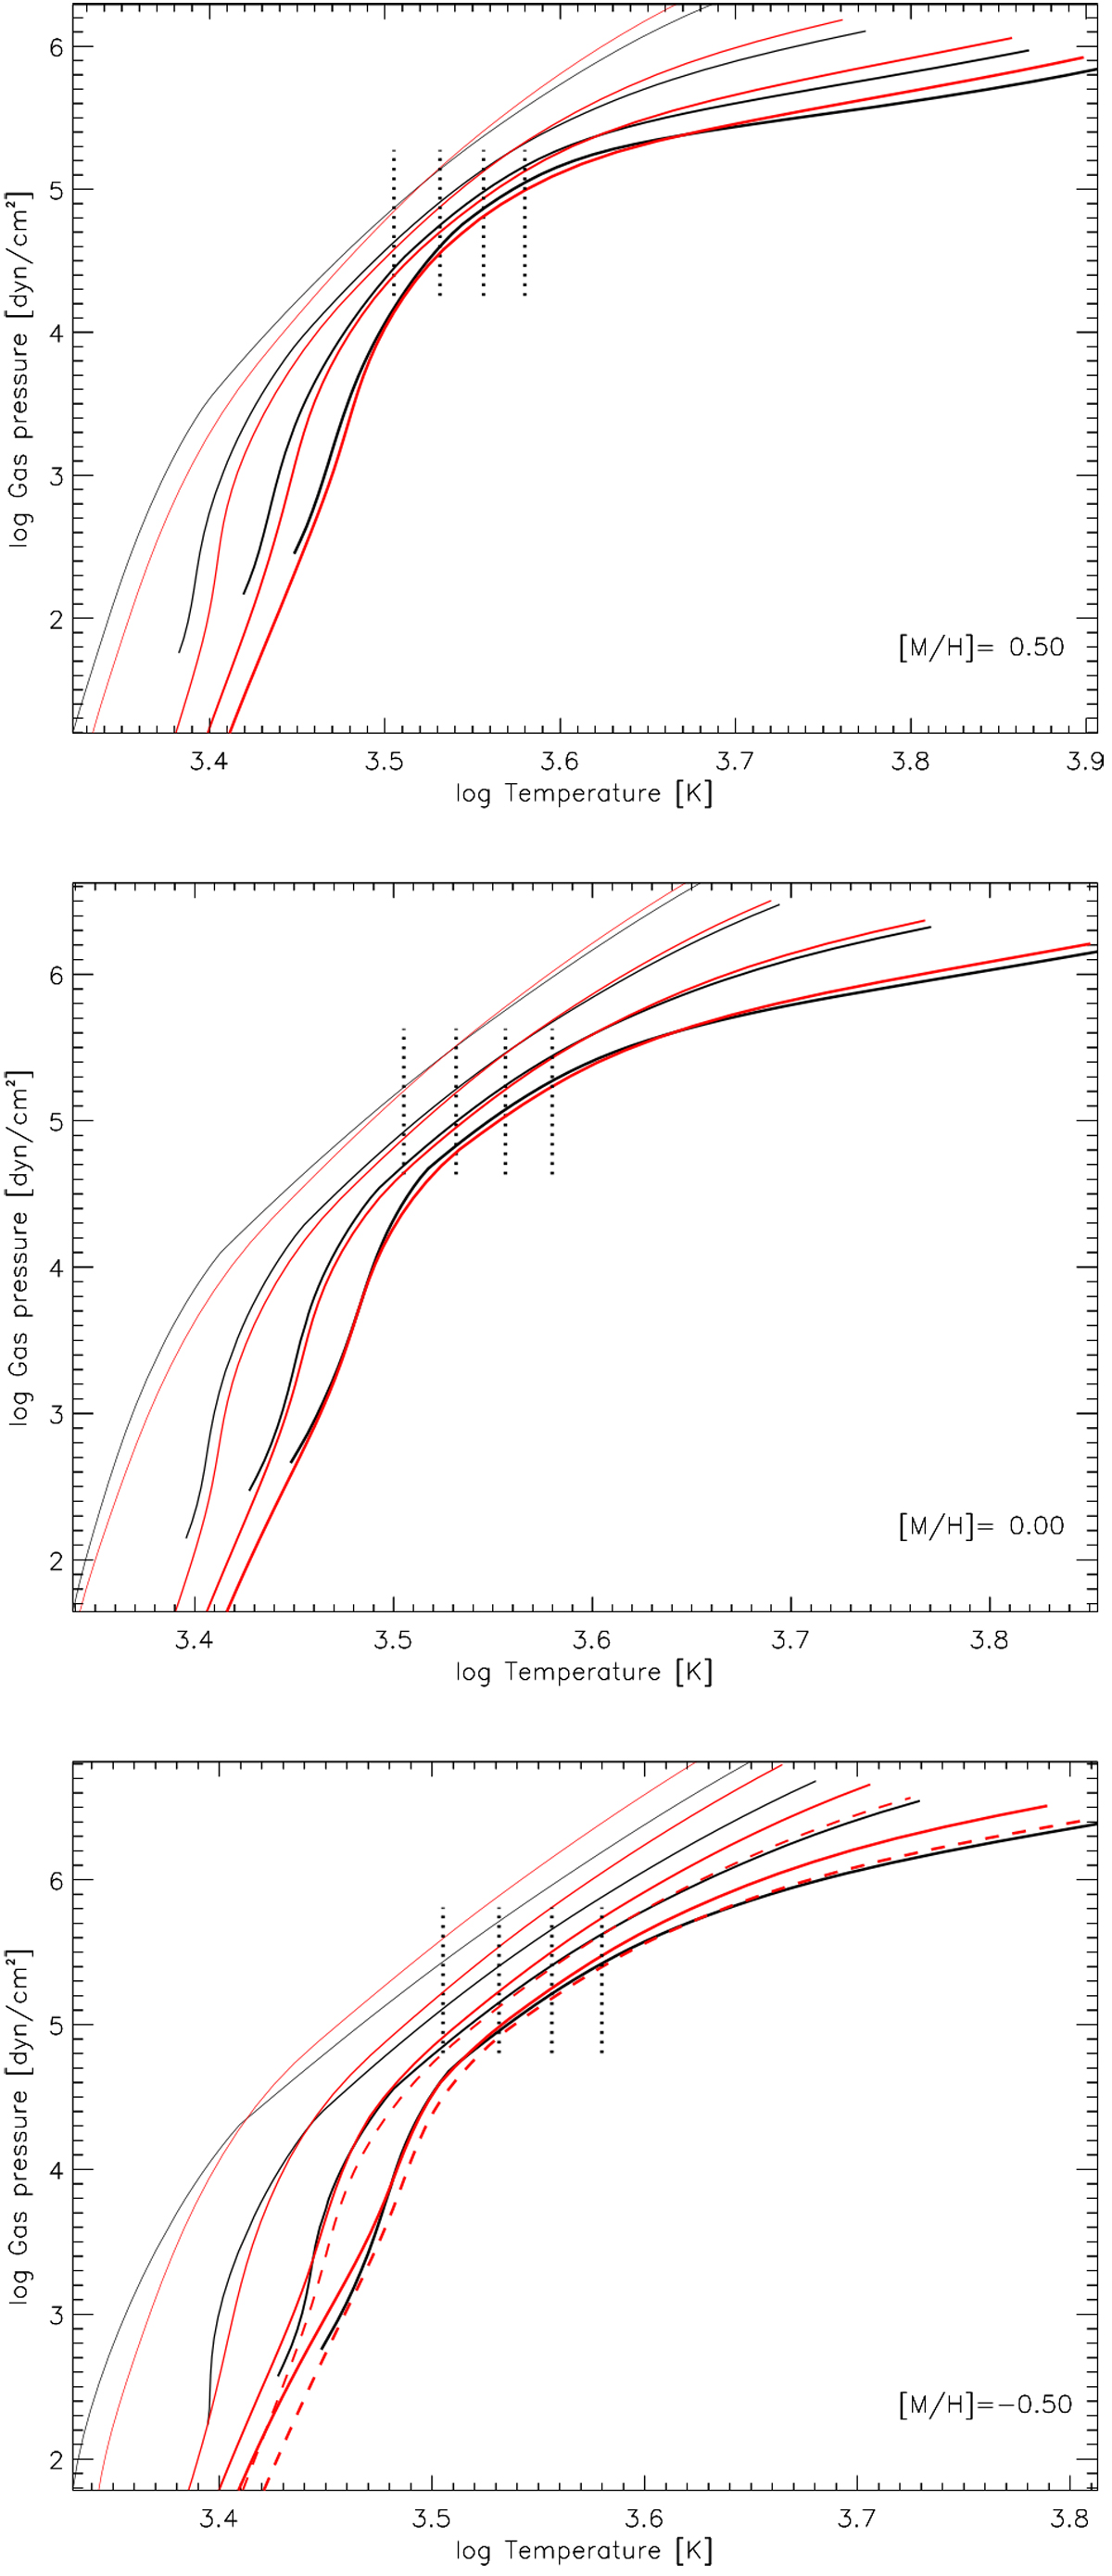
Comparison of temperature–pressure profiles for MARCS (black solid lines) and PHOENIX(red solid lines) model atmospheres used by L2016 and L2017, and P2018 and P2019, respectively (see text for details). Each panel shows profiles for Teff = 3200, 3400, 3600, and 3800 K (from left to right). Vertical dotted lines corresponding to the values of the effective temperatures are also shown. Three panels: profiles for three different metallicities (decreasing from the top to the bottom panel). The red dashed lines in the bottom panel correspond to PHOENIX models with [α/Fe] = +0.2 (for Teff = 3600 and 3800 K).
Current usage metrics show cumulative count of Article Views (full-text article views including HTML views, PDF and ePub downloads, according to the available data) and Abstracts Views on Vision4Press platform.
Data correspond to usage on the plateform after 2015. The current usage metrics is available 48-96 hours after online publication and is updated daily on week days.
Initial download of the metrics may take a while.