Fig. 1
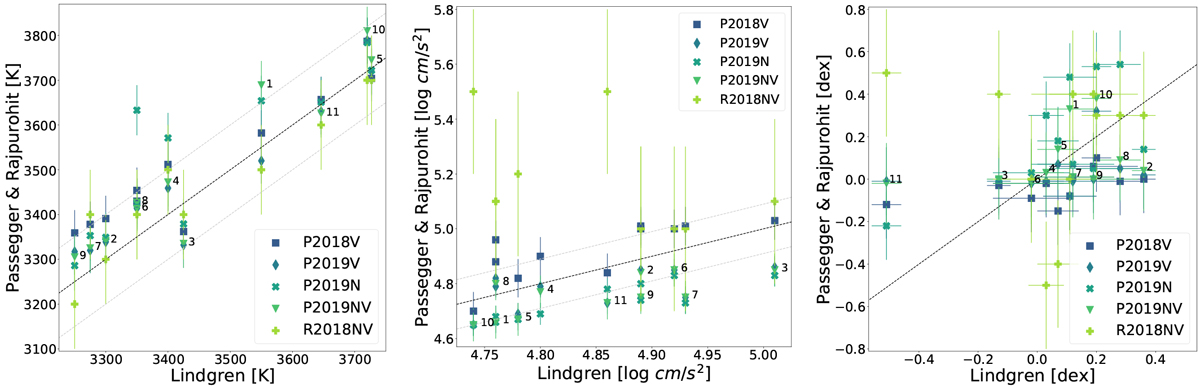
Effective temperature (left), surface gravity (middle), and metallicity (right) derived for stars in common in Lindgren et al. (2016) and Lindgren & Heiter (2017) on the x-axis and Passegger et al. (2018, 2019); Rajpurohit et al. (2018) on the y-axis. See Table A.1 for star numbers and parameter values. The different symbols, designated V, N, and NV in the legend, indicate the wavelength regions (visual, near-infrared, and both combined) with which P2018, P2019, and R2018 derived the parameters. Error bars indicate corresponding uncertainties. The grey dashed lines indicate the mean uncertainties from L2016 and L2017 for the temperature and gravity. The black dashed diagonal line indicates a 1:1 relation. In the middle plot, showing surface gravity, the R2018 value for star number 4 is outside of the range of the plot. It has a surface gravity of 4 log cm s−2.
Current usage metrics show cumulative count of Article Views (full-text article views including HTML views, PDF and ePub downloads, according to the available data) and Abstracts Views on Vision4Press platform.
Data correspond to usage on the plateform after 2015. The current usage metrics is available 48-96 hours after online publication and is updated daily on week days.
Initial download of the metrics may take a while.