Fig. 12
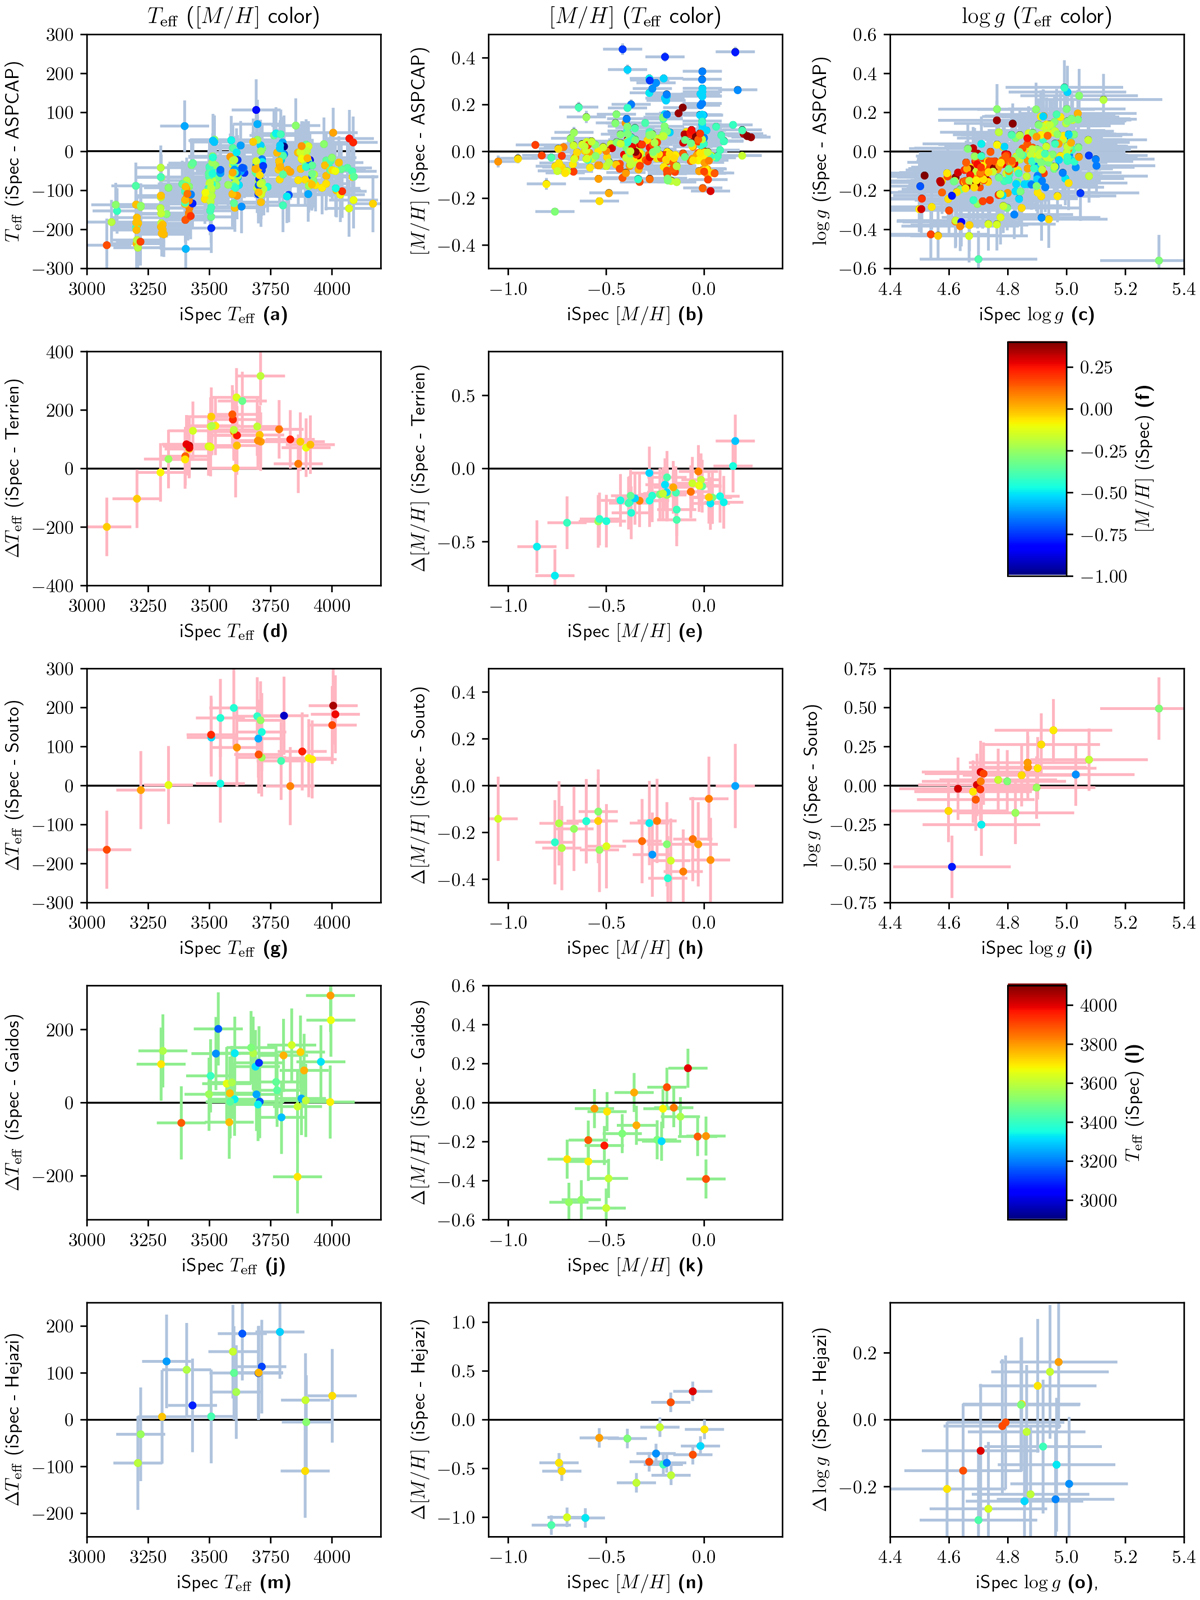
Comparisons between our output parameters and those available in the literature, colored according to either our method’s measured [M/H] (Teff plots, left column; see scale at (f)) or Teff for each star ([M/H], center column, and log g, right column, see color scale at (l)). From top to bottom: comparisons with ASPCAP (a, b, c), Terrien et al. (2015) (d, e), Souto et al. (2020) (g, h, i), Gaidos et al. (2014) (j, k), Hejazi et al. (2020) (m, n, o). Temperature values are displayed in Kelvin, while metallicity and surface gravity are in dex.
Current usage metrics show cumulative count of Article Views (full-text article views including HTML views, PDF and ePub downloads, according to the available data) and Abstracts Views on Vision4Press platform.
Data correspond to usage on the plateform after 2015. The current usage metrics is available 48-96 hours after online publication and is updated daily on week days.
Initial download of the metrics may take a while.