Fig. 4.
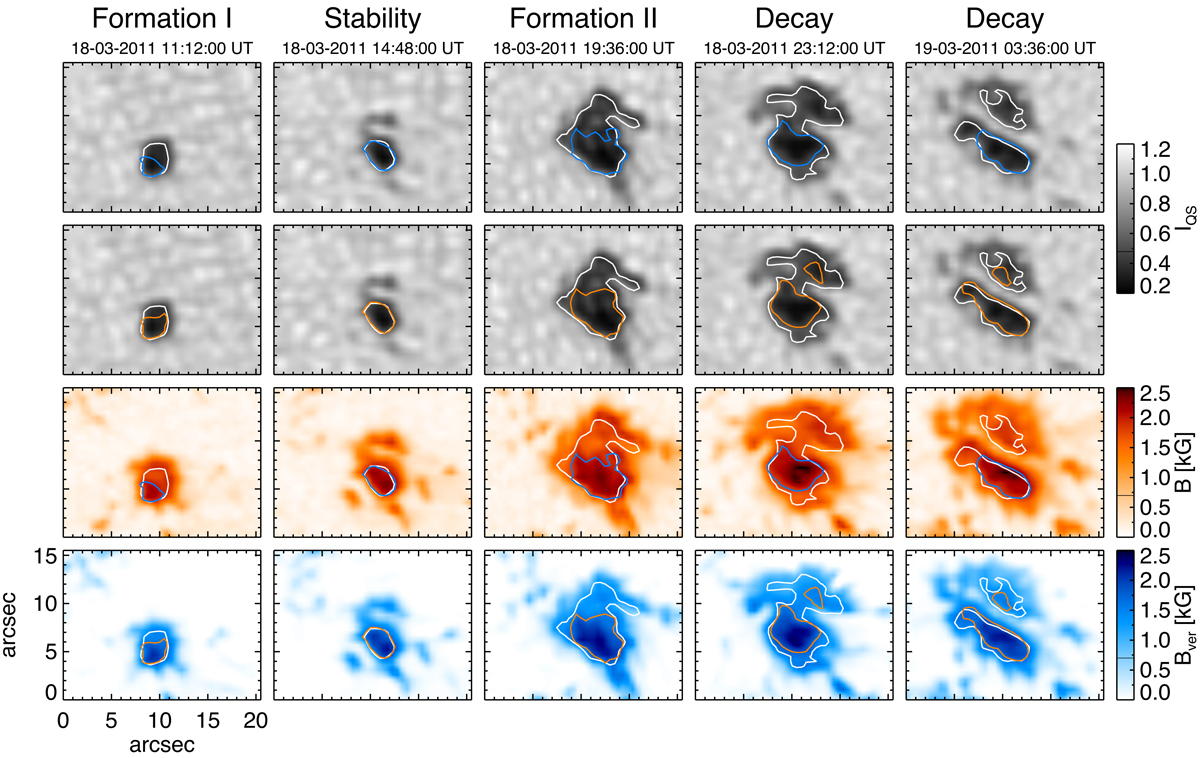
SDO/HMI samples of the evolutionary stages during the lifetime of the pore. Top row: intensity maps with intensity (Ic = 0.55 IQS; white) and magnetic field strength contours (B = 1921 G; blue). Second row: intensity maps with intensity (Ic = 0.55 IQS; white) and Bver contours (Bver = 1731 G; orange). Third row: maps of magnetic field strength with contours identical to those in top row. Bottom row: maps of Bver with contours identical to those in second row.
Current usage metrics show cumulative count of Article Views (full-text article views including HTML views, PDF and ePub downloads, according to the available data) and Abstracts Views on Vision4Press platform.
Data correspond to usage on the plateform after 2015. The current usage metrics is available 48-96 hours after online publication and is updated daily on week days.
Initial download of the metrics may take a while.