Fig. 3.
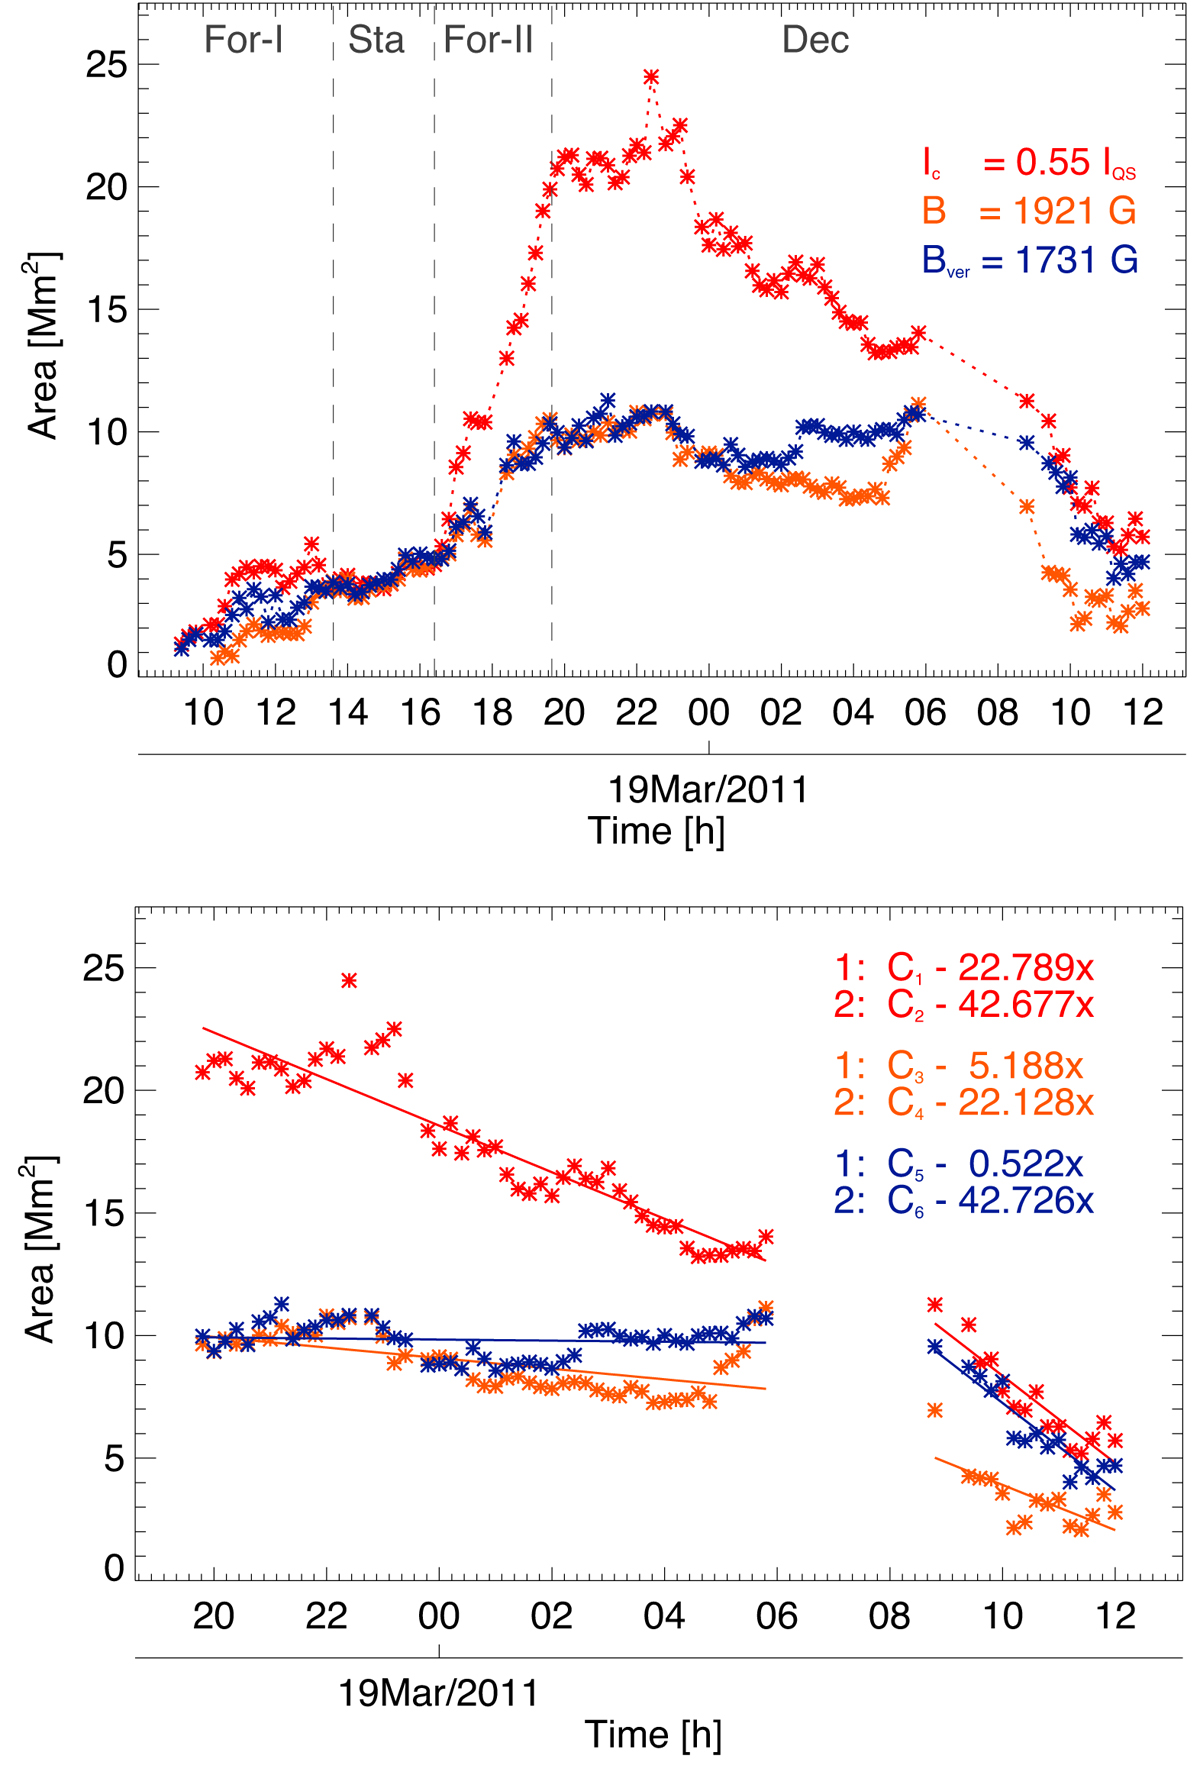
Temporal evolution of the areas of the pore encircled by both intensity and magnetic thresholds. Top: comparison of the area of the pore encircled by the isocontours Ic = 0.55 IQS (red), B = 1921 G (orange), and Bver = 1731 G (blue). Vertical lines divide the evolutionary stages of the pore as in Fig. 2. Bottom: detail of the decaying stage. The straight lines are linear fits of the decay for each of the sub-periods (1, 2) with the continuous data available.
Current usage metrics show cumulative count of Article Views (full-text article views including HTML views, PDF and ePub downloads, according to the available data) and Abstracts Views on Vision4Press platform.
Data correspond to usage on the plateform after 2015. The current usage metrics is available 48-96 hours after online publication and is updated daily on week days.
Initial download of the metrics may take a while.