Fig. 8
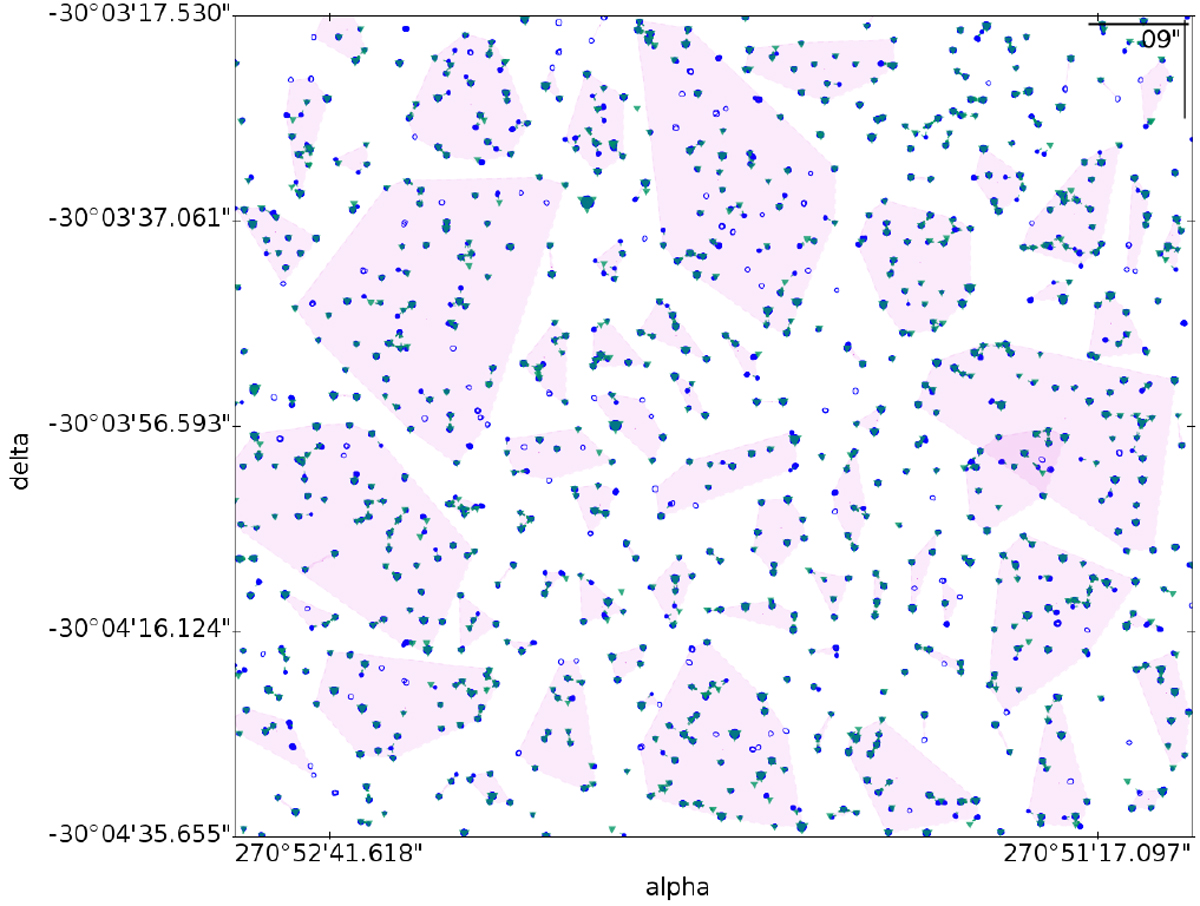
Sample of the isolated groups (pink areas represent their convex hull) of detections (blue dots) and inputsources (green triangles) determined in a small region of 2.3 square arcminutes in Baade’s Window. If the group is small enough (e.g. a group with only an isolated detection), the pink area is hard to detect in this large area. A total of 10 400 detections in the Gaia onboard magnitude range 11.66 < G < 20.58 are distributed over 30 scans, and 827 source candidates lie in the Gaia magnitude range 11.66 < G < 21.12. The total of created isolated groups is 145, the largest group has 1554 detections and 126 sources.
Current usage metrics show cumulative count of Article Views (full-text article views including HTML views, PDF and ePub downloads, according to the available data) and Abstracts Views on Vision4Press platform.
Data correspond to usage on the plateform after 2015. The current usage metrics is available 48-96 hours after online publication and is updated daily on week days.
Initial download of the metrics may take a while.