Fig. 3
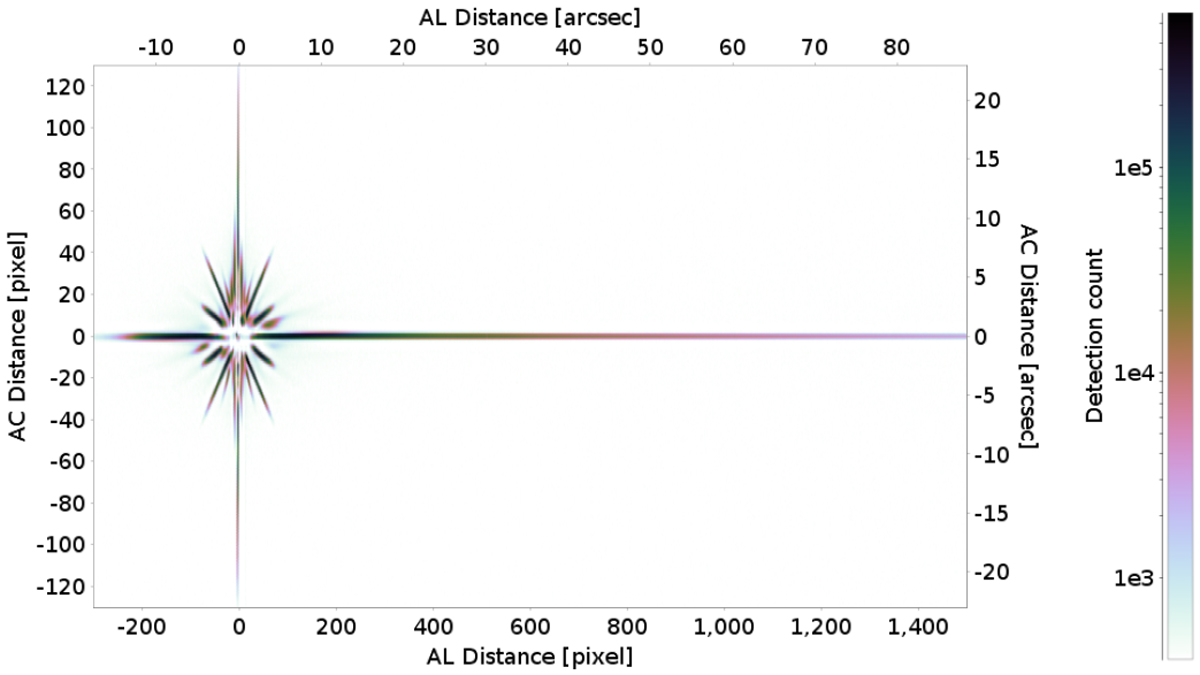
Density map obtained by stacking the onboard detections of about 560 objects in the magnitude range 10 to 10.5 during the full Gaia EDR3 time period. The extent of the diffraction spikes, mainly in the AL direction, increases with source brightness. It is larger in the trailing region (to the right) as a result of a charge transfer inefficiency in the CCDs.
Current usage metrics show cumulative count of Article Views (full-text article views including HTML views, PDF and ePub downloads, according to the available data) and Abstracts Views on Vision4Press platform.
Data correspond to usage on the plateform after 2015. The current usage metrics is available 48-96 hours after online publication and is updated daily on week days.
Initial download of the metrics may take a while.