Fig. 2
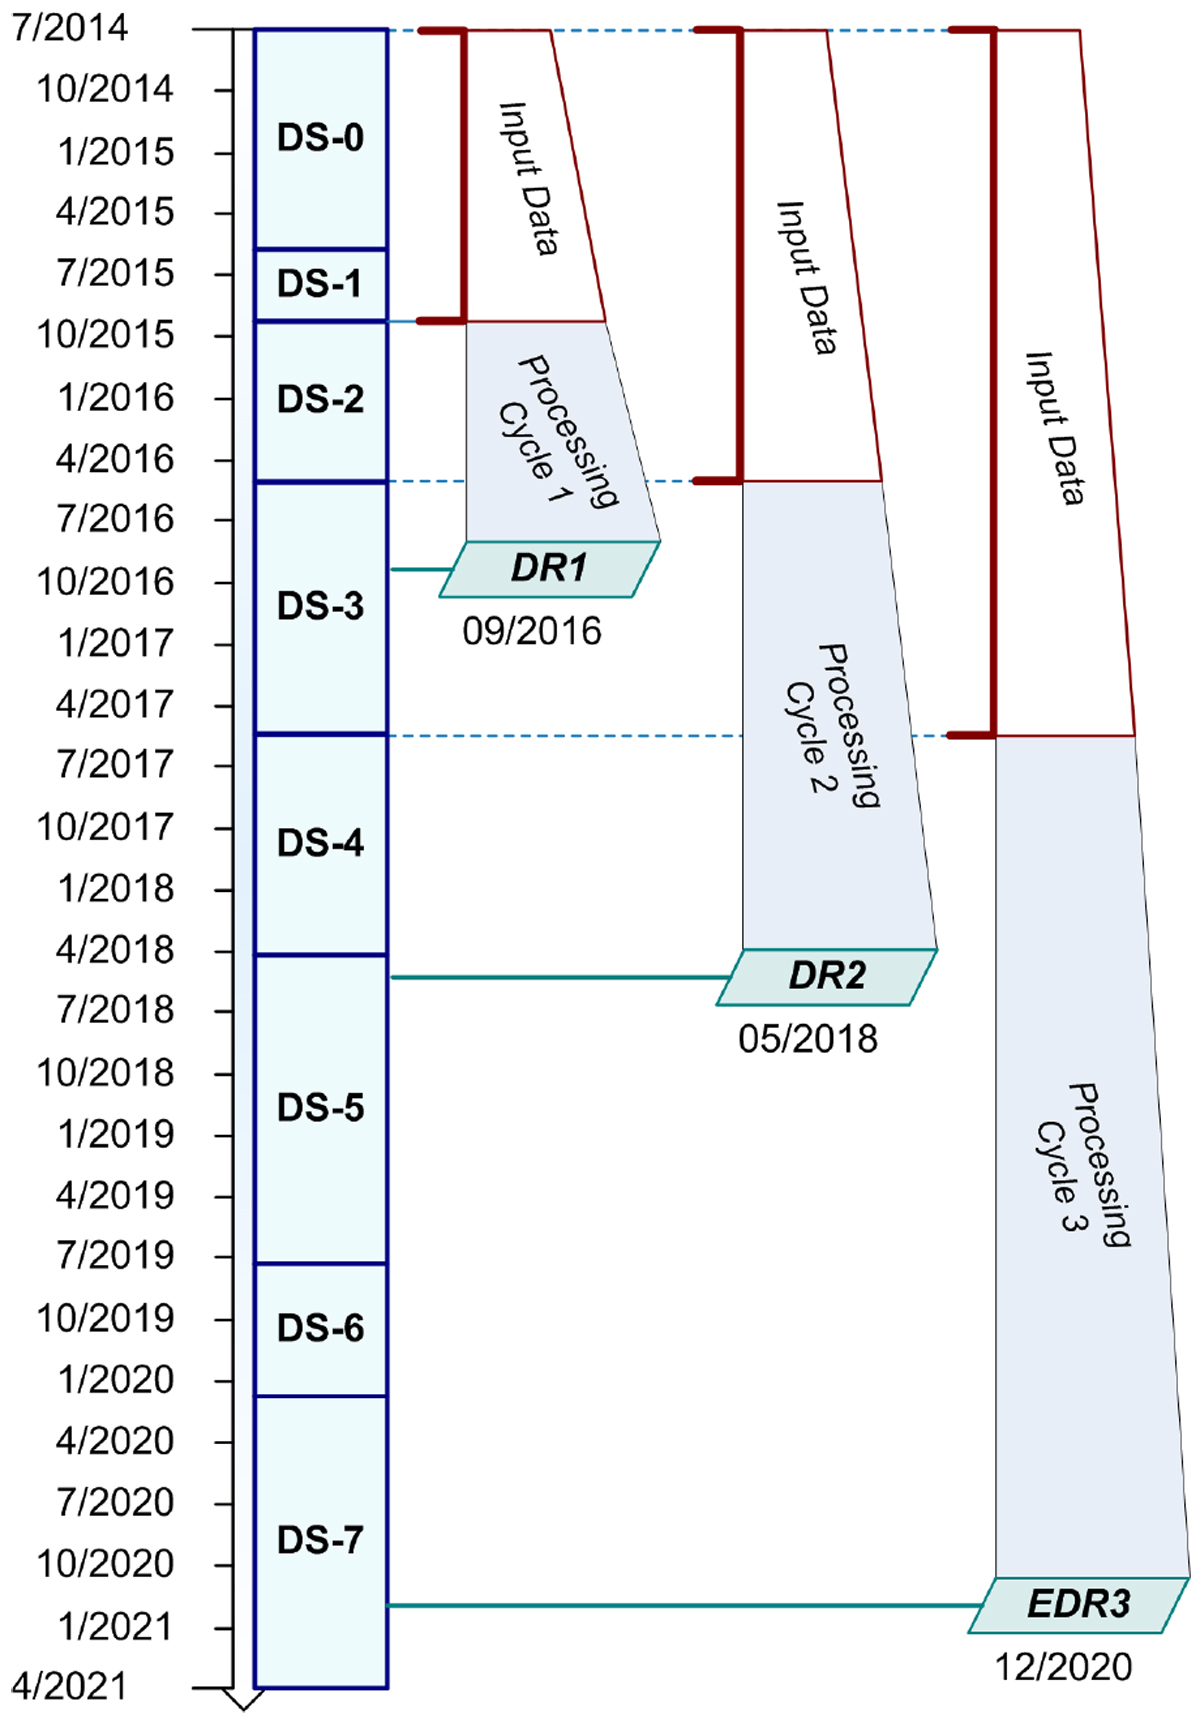
Schematic diagram of the data segments since the start of nominal operations in July 2014 up to the Gaia EDR3 publication. New data are received on a daily basis from the spacecraft and continuously enter the Gaia data-processing pipeline. This data stream is partitioned into data segments to identify and coordinate the data entering each processing cycle from which Gaia DRs are produced. In each processing cycle, all accumulated data segments are processed again, superseding any preceding solution. DS-0 covers 313 days and 22.2 billion detections, DS-1 covers 105 days and 8 billion detections, DS-2 covers 250 days and 22.1 billion detections, and DS-3, which is the new data segment for Gaia EDR3, covers 370 days and 25.7 billion detections.
Current usage metrics show cumulative count of Article Views (full-text article views including HTML views, PDF and ePub downloads, according to the available data) and Abstracts Views on Vision4Press platform.
Data correspond to usage on the plateform after 2015. The current usage metrics is available 48-96 hours after online publication and is updated daily on week days.
Initial download of the metrics may take a while.