Free Access
Fig. 15
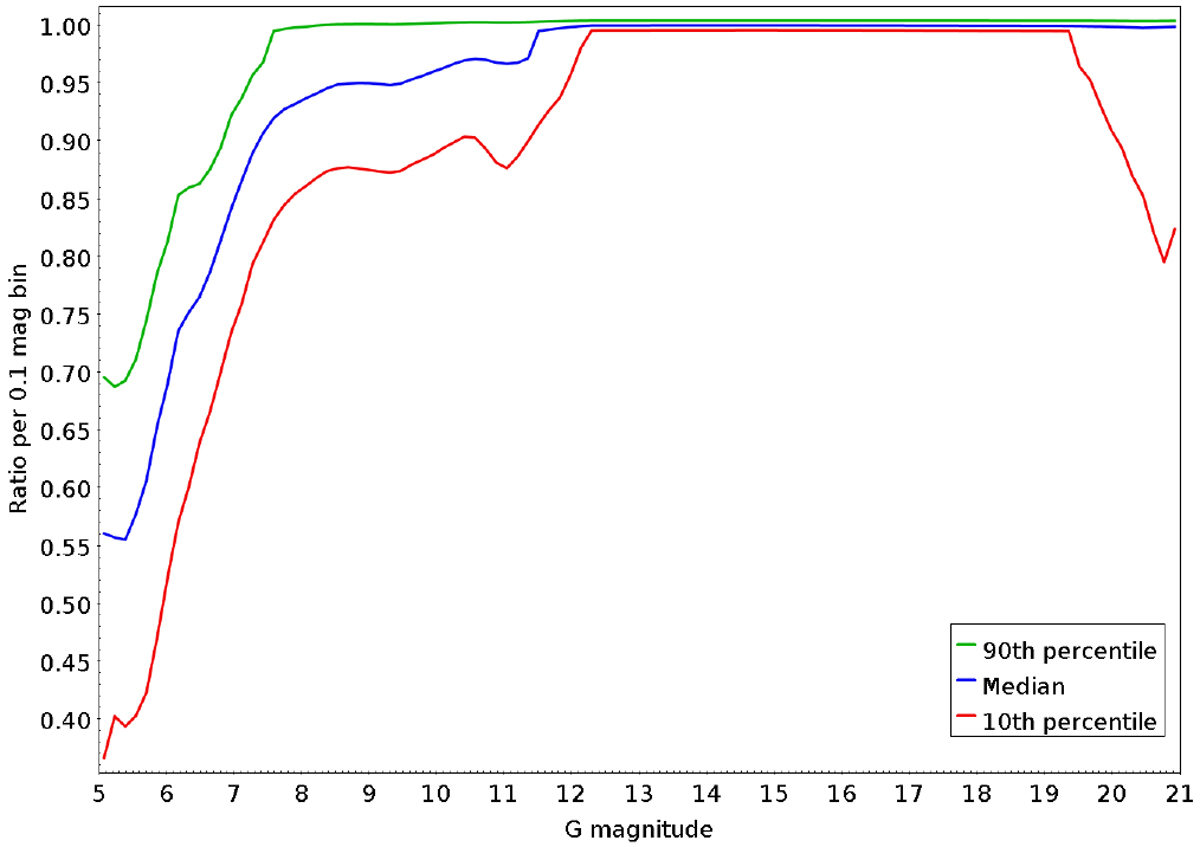
Fraction of matched transits that are retained from the Gaia DR2 XM solution by magnitude for the sources after the XM solution. The top horizontal green line shows the location of the 90th percentile, the blue line shows the location of the median, and the red line shows the location of the 10th percentile.
Current usage metrics show cumulative count of Article Views (full-text article views including HTML views, PDF and ePub downloads, according to the available data) and Abstracts Views on Vision4Press platform.
Data correspond to usage on the plateform after 2015. The current usage metrics is available 48-96 hours after online publication and is updated daily on week days.
Initial download of the metrics may take a while.