Fig. 12
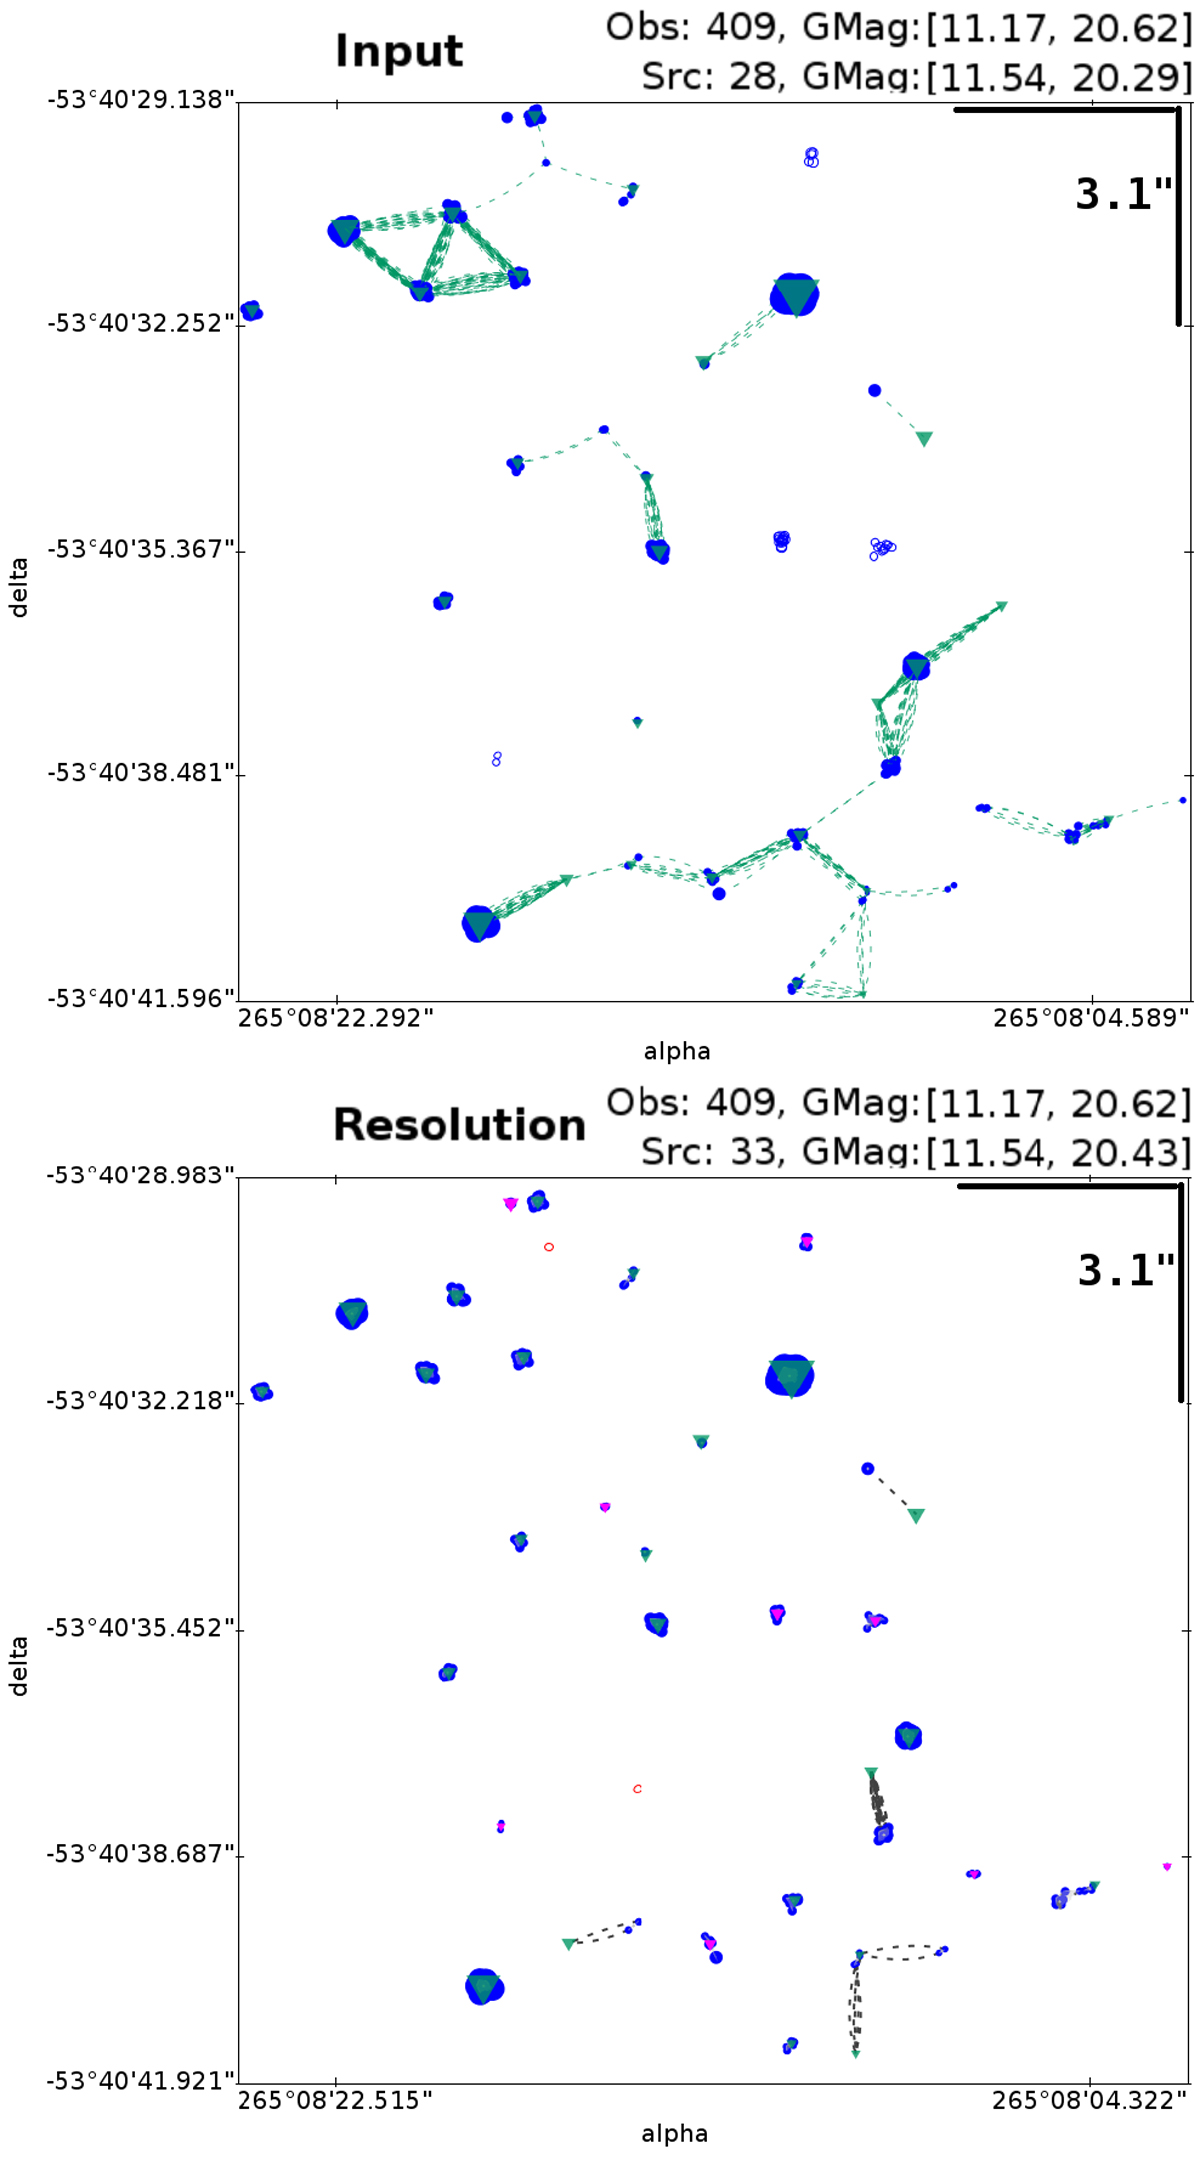
XMsolution in a dense region. Top: isolated group of detections (input of the clustering solution). Bottom: XM resolution including red dots for rejected detections. These plots use the same symbols as in Fig. 9. The isolated group of detections includes 409 detections in the Gaia onboard magnitude range 11.17 <G < 20.62 and 28 source candidates in the Gaia magnitude range 11.54 < G < 20.29. The XM solution for the current cycle contains 33 sources in the Gaia magnitude range 11.54 <G < 20.43.
Current usage metrics show cumulative count of Article Views (full-text article views including HTML views, PDF and ePub downloads, according to the available data) and Abstracts Views on Vision4Press platform.
Data correspond to usage on the plateform after 2015. The current usage metrics is available 48-96 hours after online publication and is updated daily on week days.
Initial download of the metrics may take a while.