Fig. 11
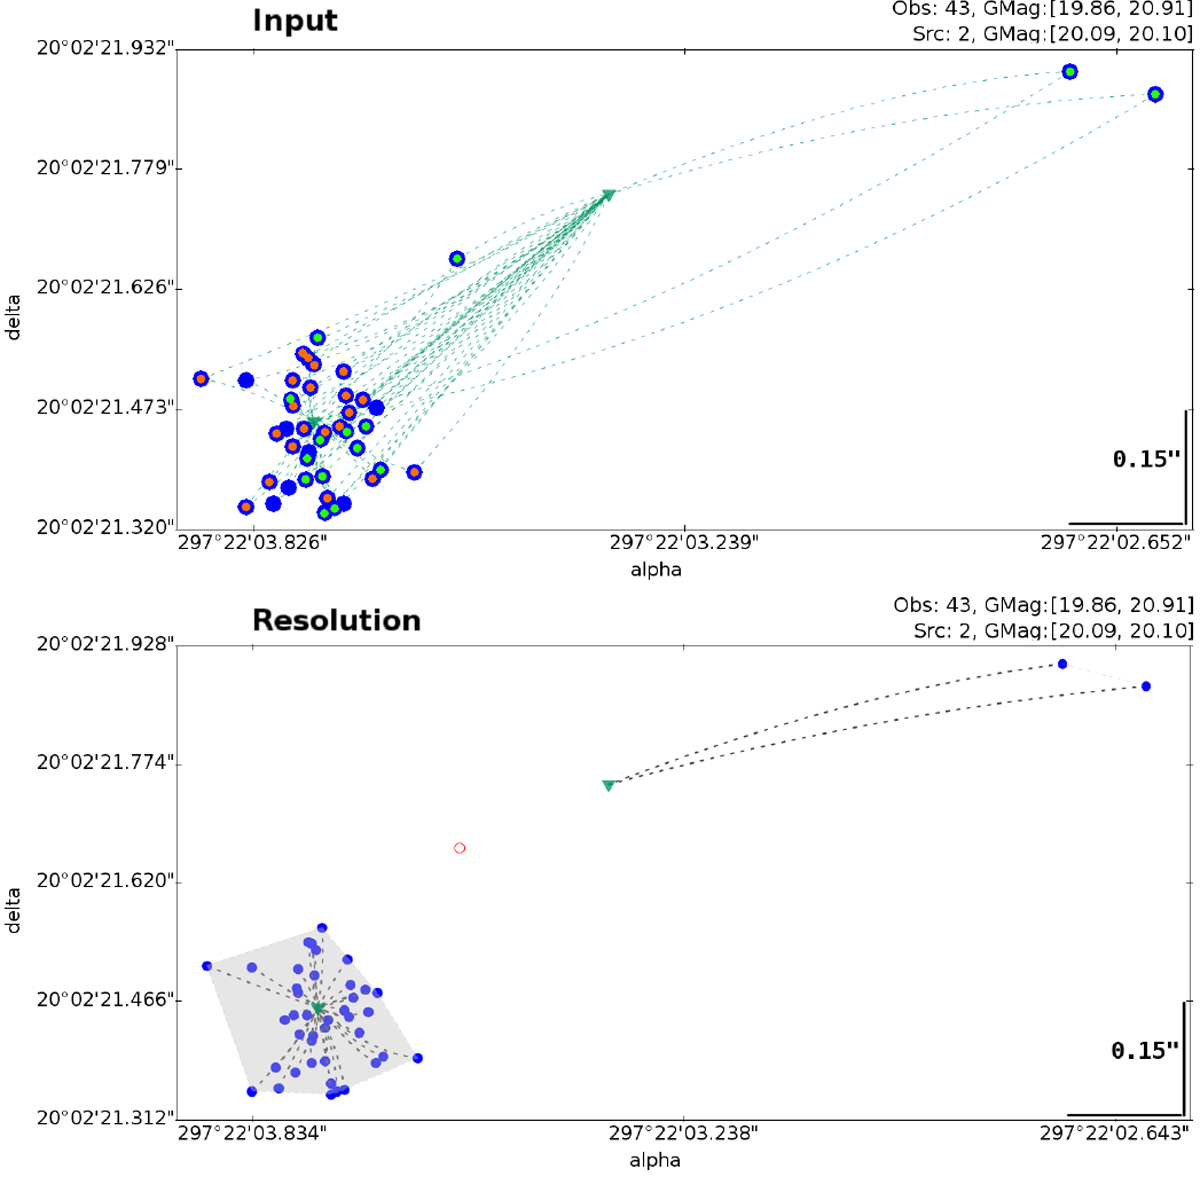
XM solution. Top: isolated group of detections (input of the clustering solution). Bottom: XM resolution including arejected detection as an empty red dot. These plots use the same symbols as in Fig. 9. The detections with the green dot were matched to one source for Gaia DR2, the detections with the orangedot were matched to the other source, and the remainder are new detections from DS-03. The isolated group of detections in the top panel includes 43 transits in the Gaia onboard magnitude range 19.86 <G < 20.91 and 2 source candidates with a magnitude G = 20.09 and G = 20.10. We note that the positions of already existing input sources are not updated in the XM resolution, they are updated in the subsequent astrometric pipeline run based on the new XM solution.
Current usage metrics show cumulative count of Article Views (full-text article views including HTML views, PDF and ePub downloads, according to the available data) and Abstracts Views on Vision4Press platform.
Data correspond to usage on the plateform after 2015. The current usage metrics is available 48-96 hours after online publication and is updated daily on week days.
Initial download of the metrics may take a while.