Fig. 10
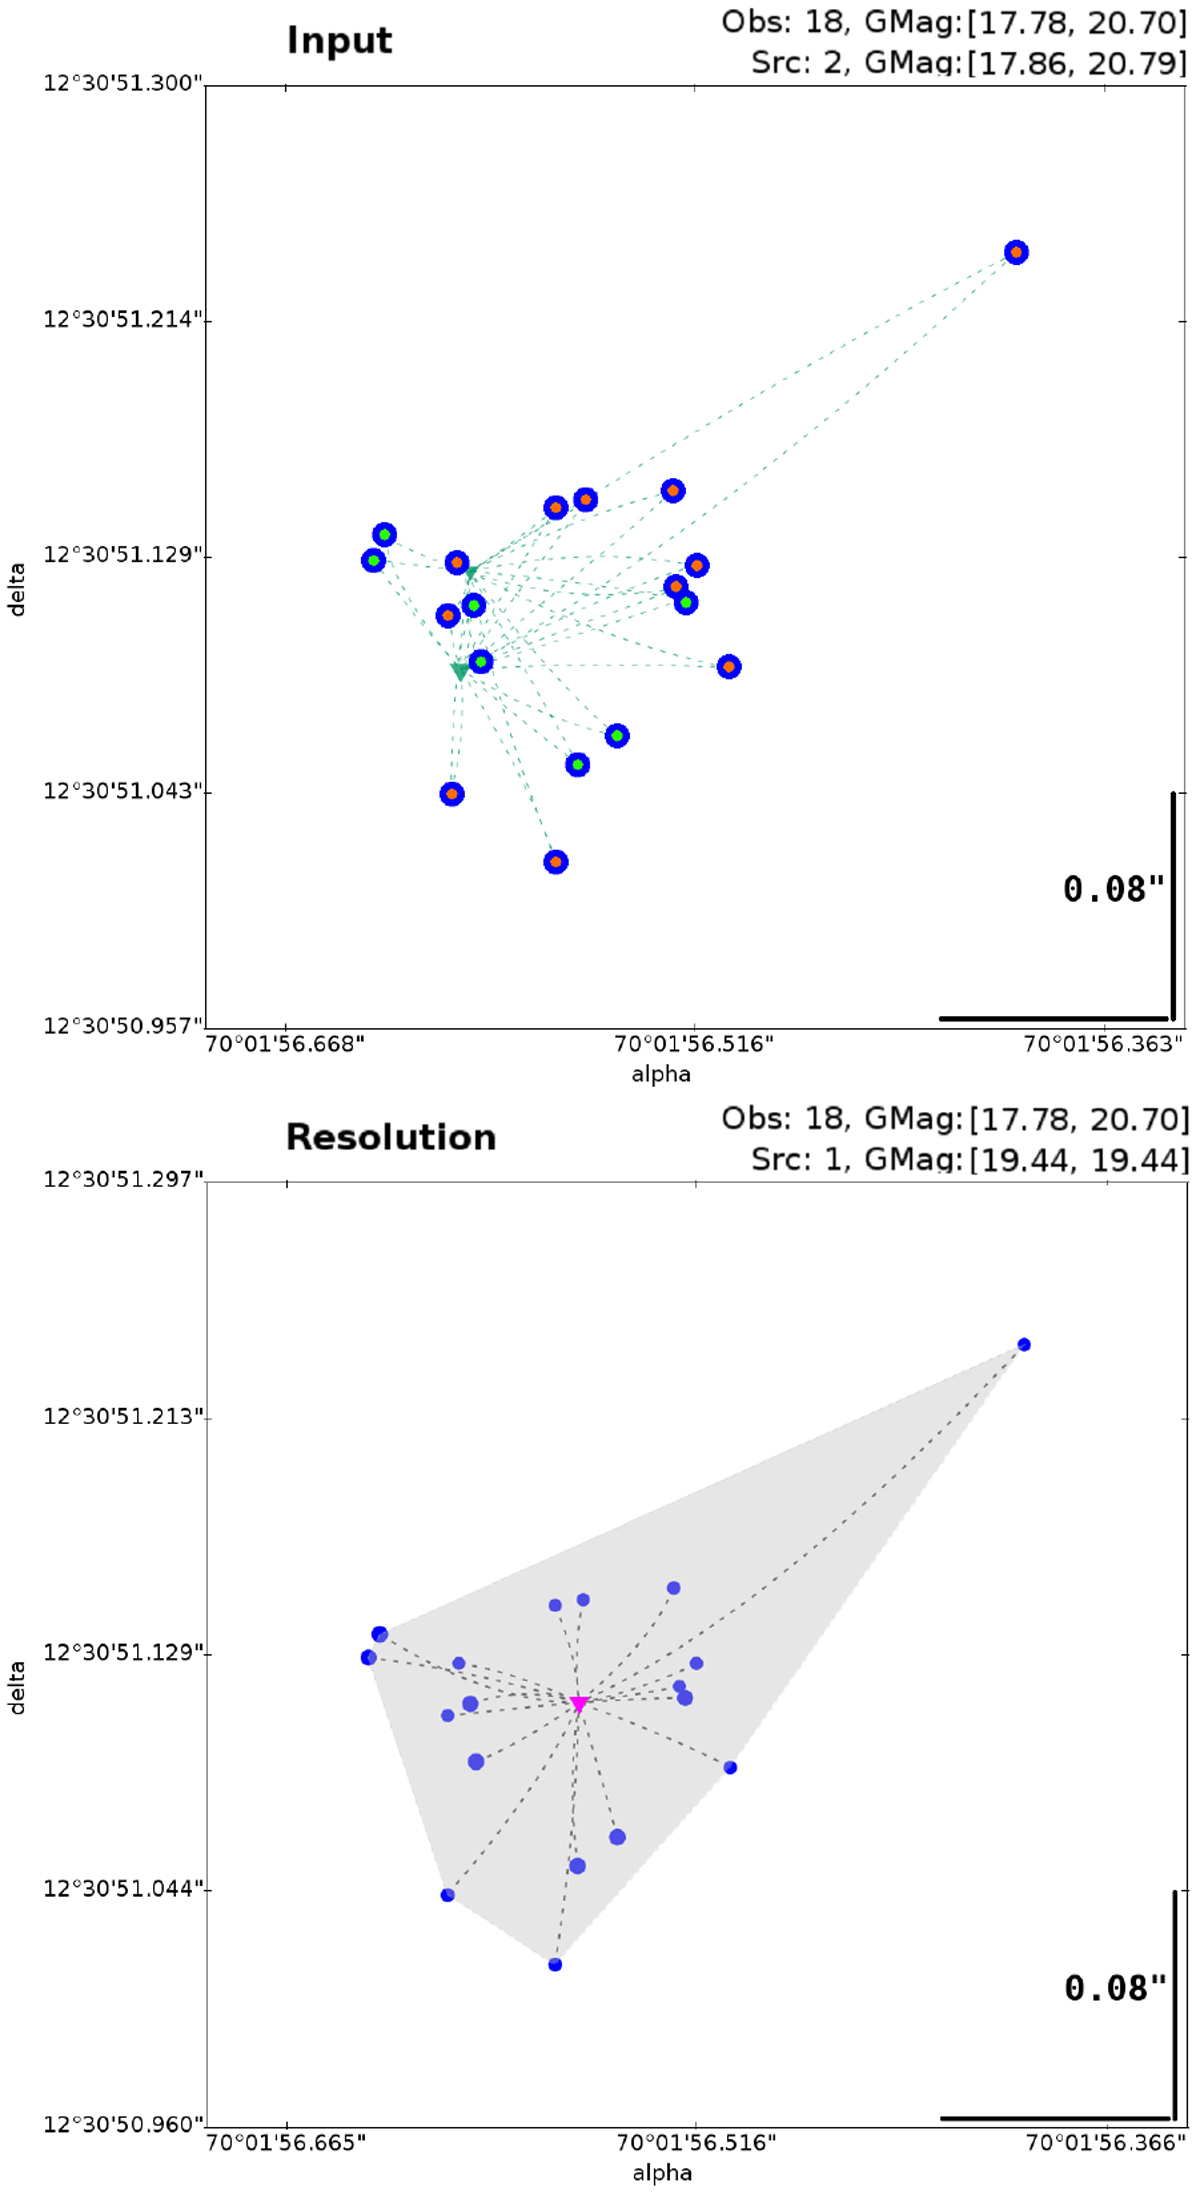
XM solution around Gaia 16abo. Top: isolated group of detections (input of the clustering solution). Bottom: XM resolution. These plots use the same symbols as in Fig. 9. The detections with the green dot are the bright detections matched to one source, whereas the detections with the orange dot are the fainter detections matched to the other source as resolved for Gaia DR2. The isolated group of detections in the top panel includes 18 detections in the Gaia onboard magnitude range 17.78 <G < 20.70 and two source candidates with a magnitude G = 17.86 and G = 20.79. The XM solution creates a unique source with a magnitude G = 19.44 corresponding to the mean of the Gaia onboard magnitude detection.
Current usage metrics show cumulative count of Article Views (full-text article views including HTML views, PDF and ePub downloads, according to the available data) and Abstracts Views on Vision4Press platform.
Data correspond to usage on the plateform after 2015. The current usage metrics is available 48-96 hours after online publication and is updated daily on week days.
Initial download of the metrics may take a while.