Fig. 6.
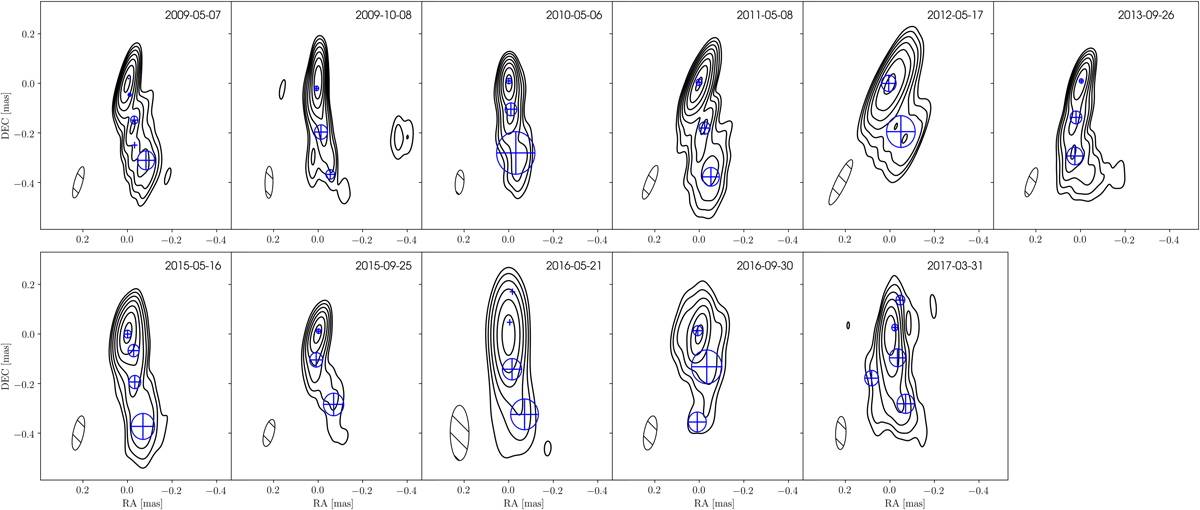
Total intensity images (black contours) of BL Lac obtained with 86 GHz GMVA observations. Contours are drawn at 0.77, 1.53, 3.02, 5.96, 11.74, 23.15, 45.65, and 90% of the peak (1.528 Jy beam−1) registered in May 2011. The restoring beams, shown at the bottom-left corner, range from 0.04 × 0.1 mas to 0.08 × 0.22 mas in FWHM. Model-fit components (blue circles) are overlaid on the maps. In May 2016 and March 2017, an additional component appears upstream of the core.
Current usage metrics show cumulative count of Article Views (full-text article views including HTML views, PDF and ePub downloads, according to the available data) and Abstracts Views on Vision4Press platform.
Data correspond to usage on the plateform after 2015. The current usage metrics is available 48-96 hours after online publication and is updated daily on week days.
Initial download of the metrics may take a while.