Fig. 5.
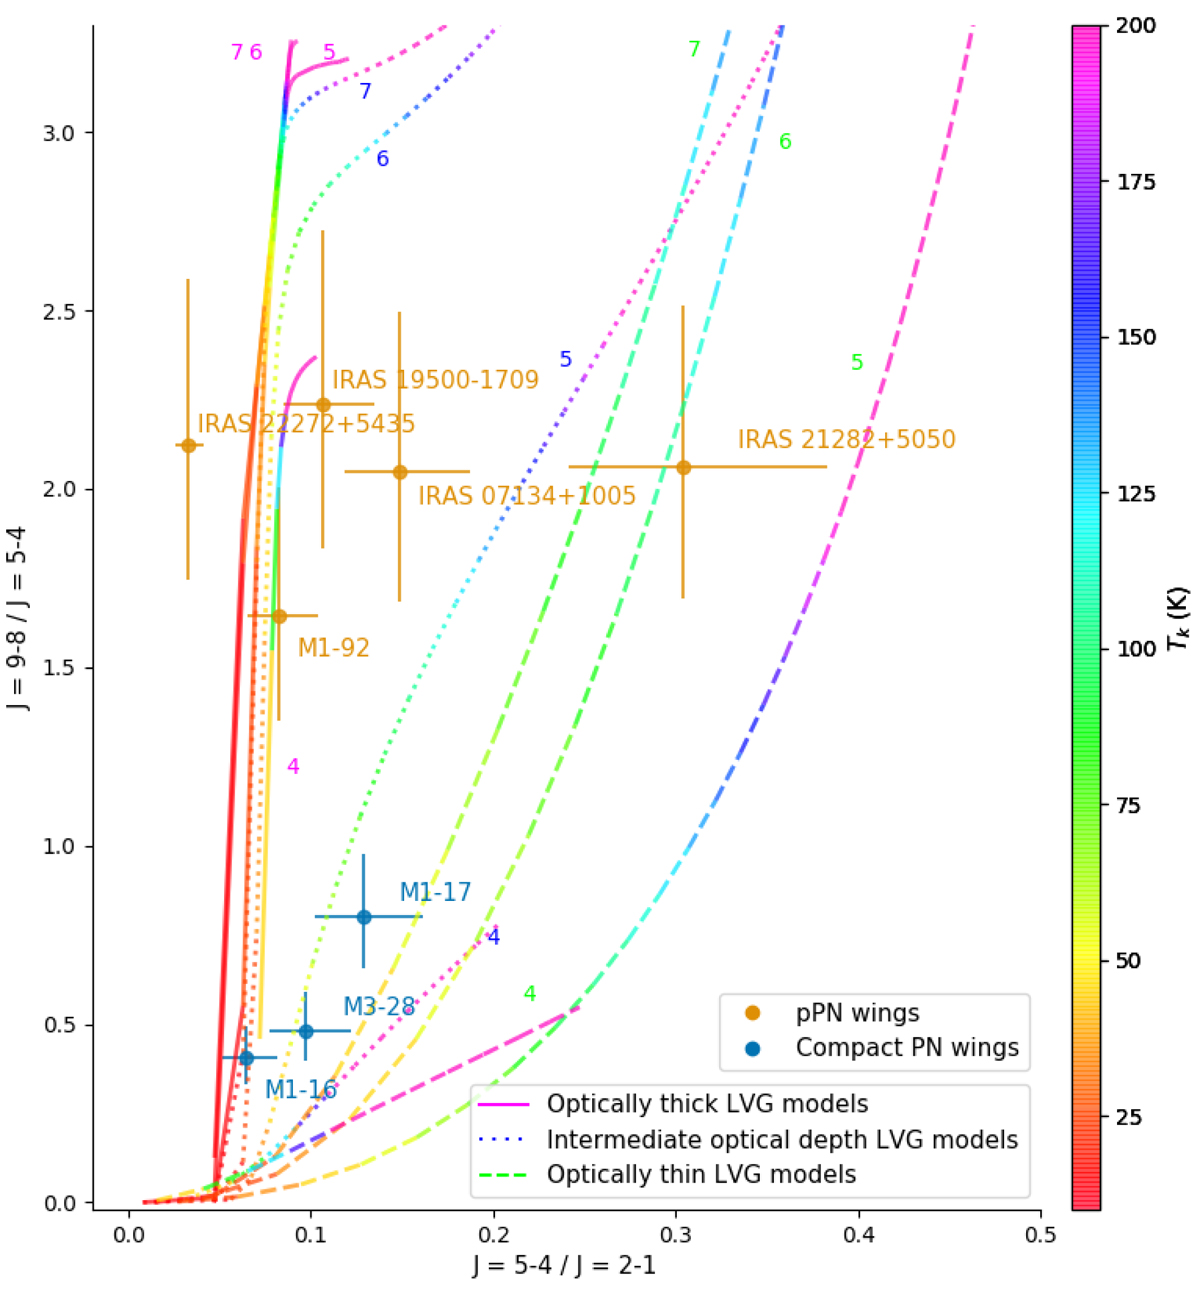
Pseudo colour-colour diagram comparing the J = 5–4/J = 2–1 and J = 9–8/J = 5–4 intensity ratios of pPNe line wings, compact PNe line wings and the LVG models for different optical depths (solid, dotted and dashed lines), densities (number indicates log10(ntot)) and temperatures (coded as shown in the colour scale). See text for further details.
Current usage metrics show cumulative count of Article Views (full-text article views including HTML views, PDF and ePub downloads, according to the available data) and Abstracts Views on Vision4Press platform.
Data correspond to usage on the plateform after 2015. The current usage metrics is available 48-96 hours after online publication and is updated daily on week days.
Initial download of the metrics may take a while.