Free Access
Fig. 4.
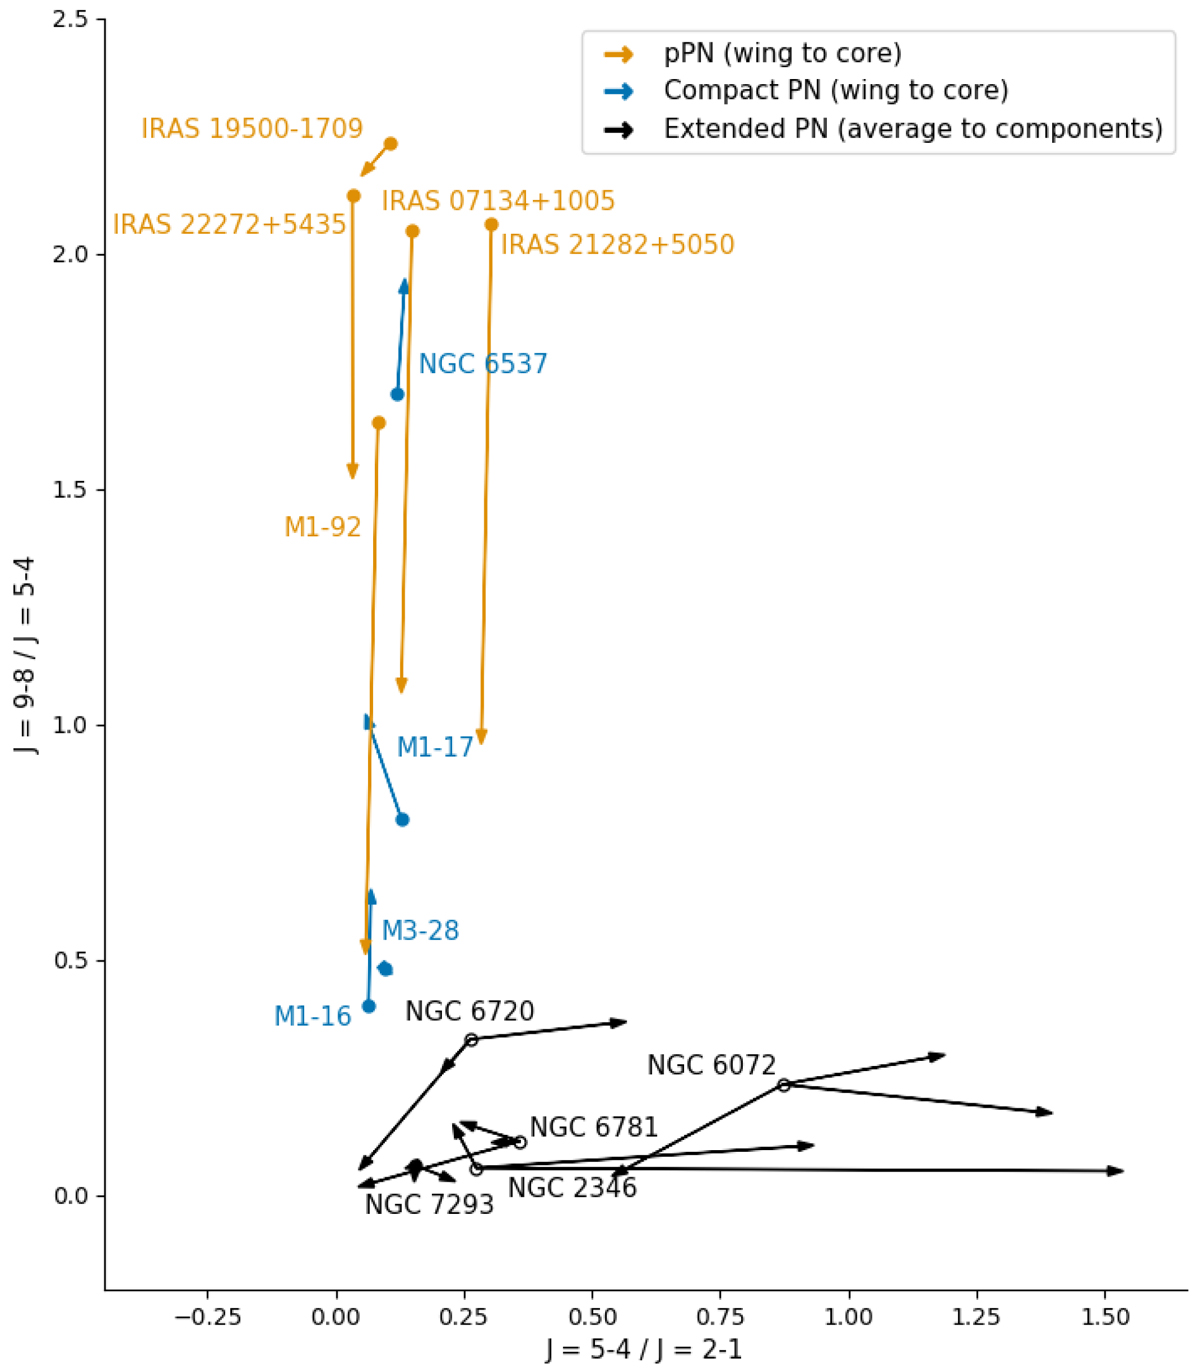
Pseudo colour-colour diagram comparing the J = 5–4/J = 2–1 and J = 9–8/J = 5–4 intensity ratios of the wings and cores of the compact sources (joined by arrows pointing towards the line cores) and the identified velocity components of the extended PNe (connecting ratios of each component to its average).
Current usage metrics show cumulative count of Article Views (full-text article views including HTML views, PDF and ePub downloads, according to the available data) and Abstracts Views on Vision4Press platform.
Data correspond to usage on the plateform after 2015. The current usage metrics is available 48-96 hours after online publication and is updated daily on week days.
Initial download of the metrics may take a while.