Fig. A.9.
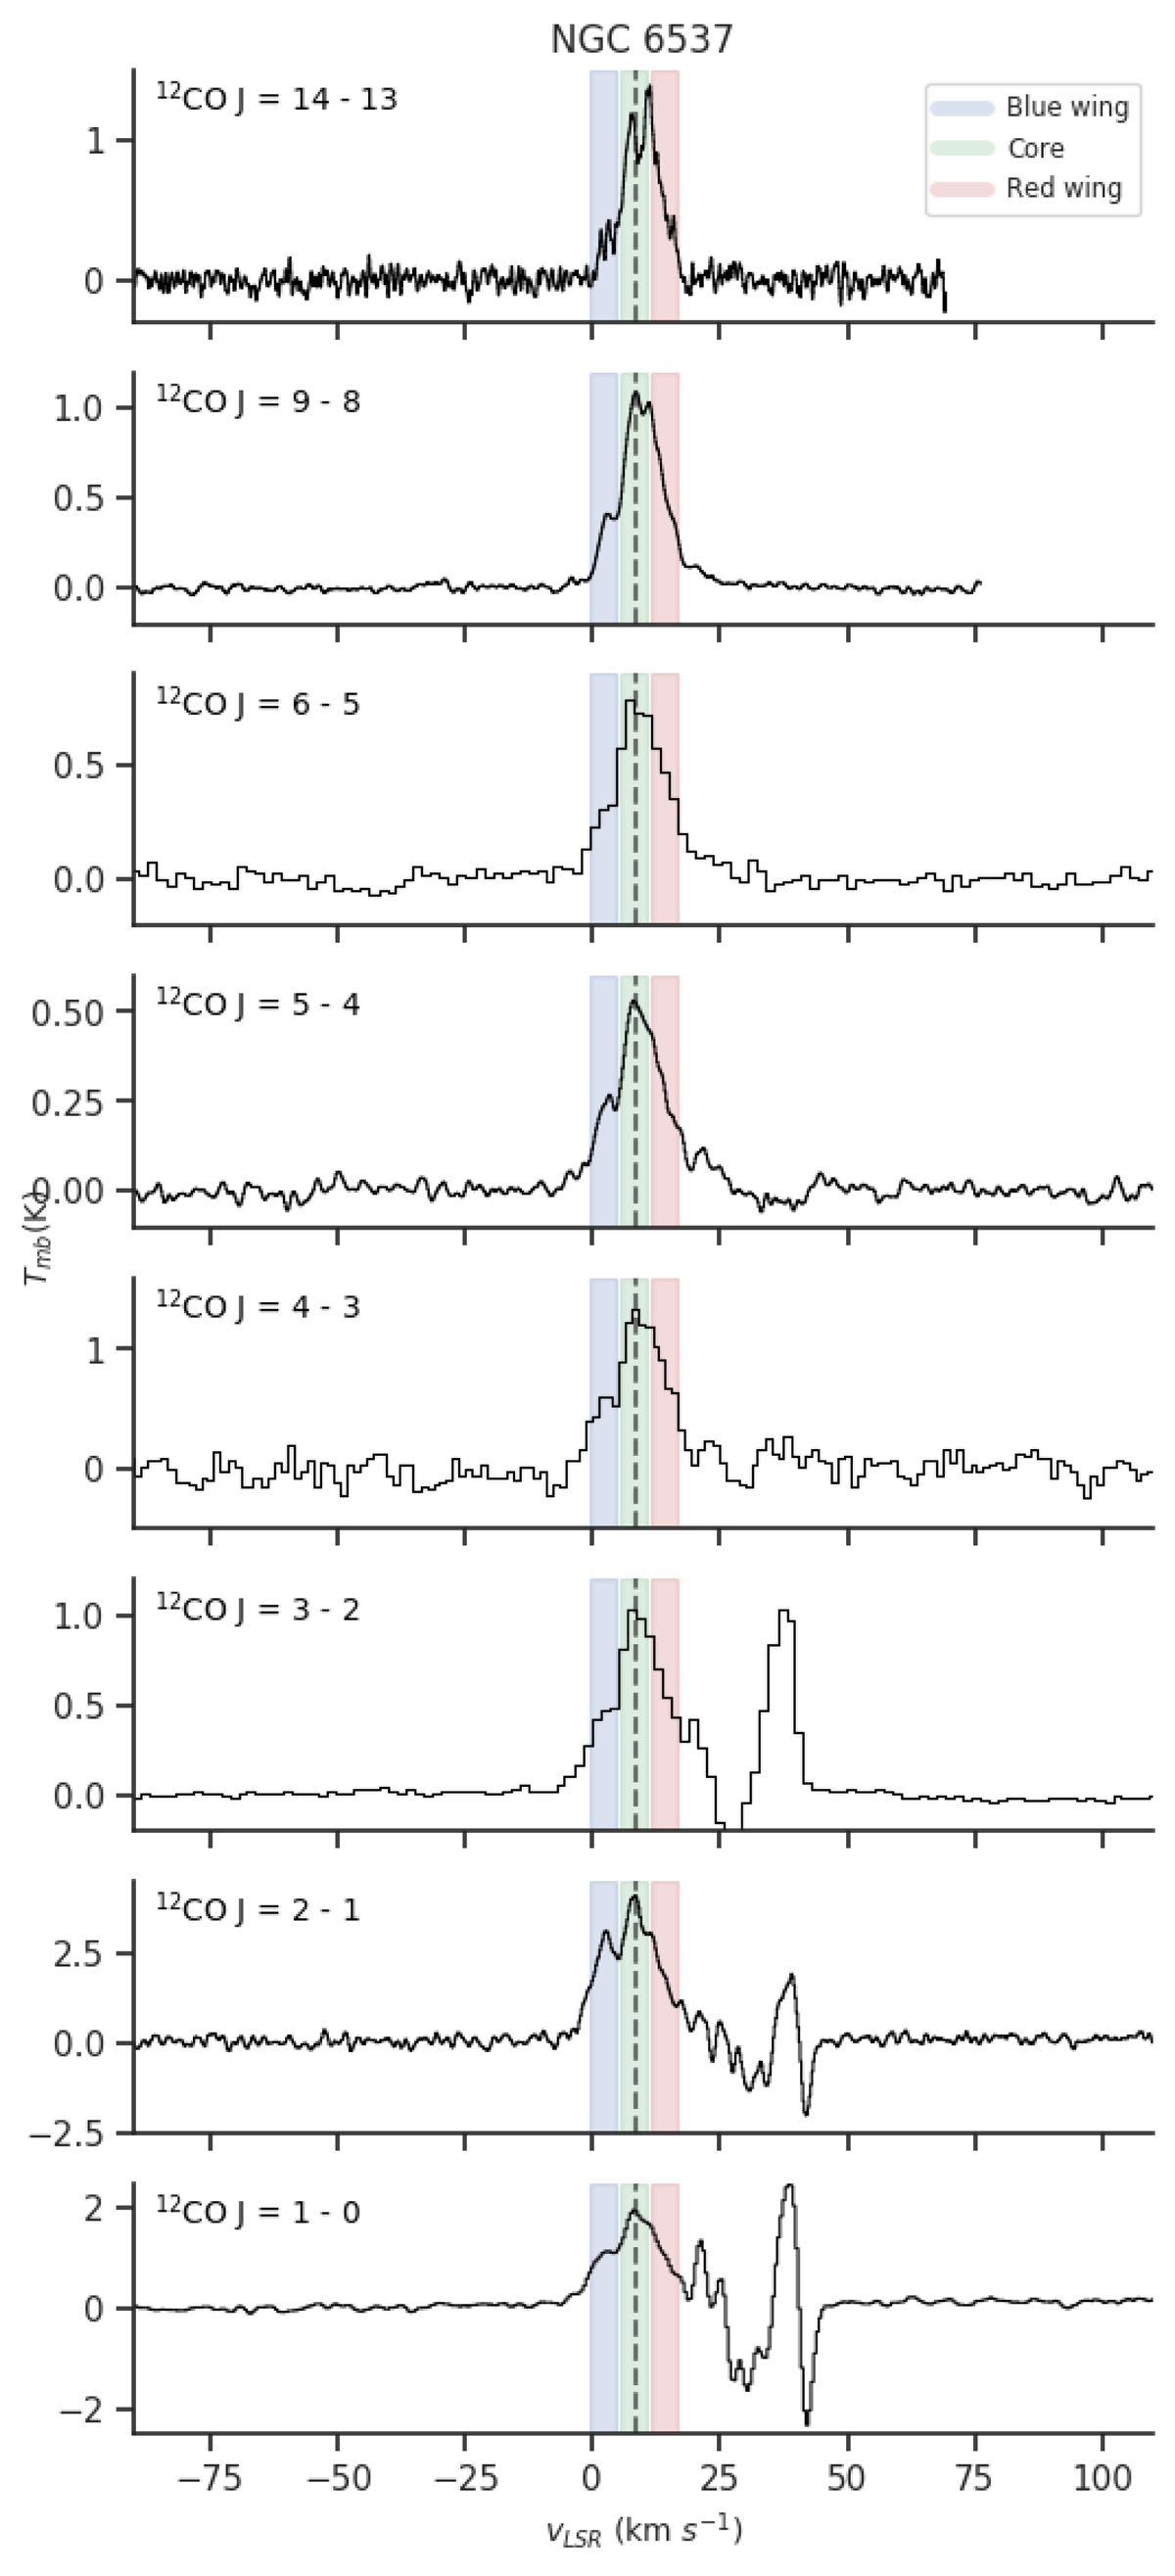
Observations of NGC 6537. Shadowed regions mark the LSR velocity ranges adopted for each feature and the dashed vertical line indicates the systemic velocity. The CO J = 3–2, J = 4–3 and J = 6–5 transitions are taken from Edwards et al. (2014). They are shown here just as an illustration of the line profile evolution between the low- and intermediate-J CO lines, but they are used in our quantitative study.
Current usage metrics show cumulative count of Article Views (full-text article views including HTML views, PDF and ePub downloads, according to the available data) and Abstracts Views on Vision4Press platform.
Data correspond to usage on the plateform after 2015. The current usage metrics is available 48-96 hours after online publication and is updated daily on week days.
Initial download of the metrics may take a while.