Fig. 39
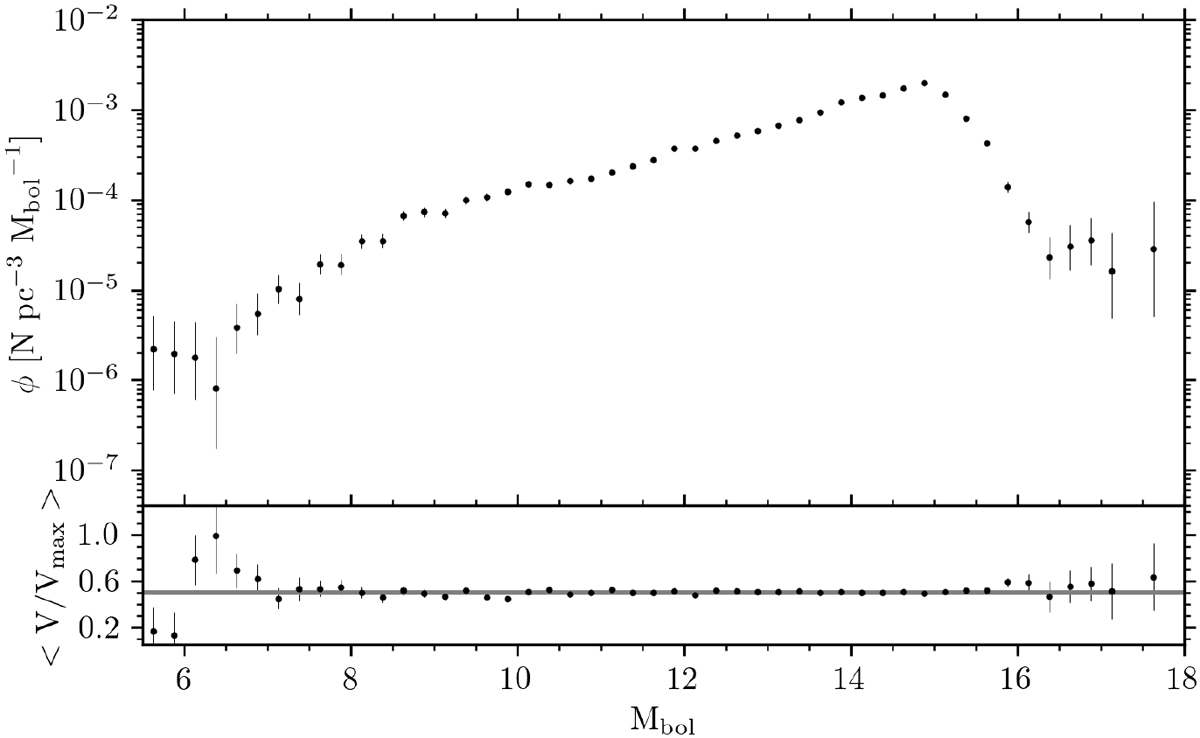
Upper panel: WDLF for the 100 pc sample. The bin width is 0.25 Mbol and theconfidence intervals are Poisson uncertainties (Gehrels 1986). The structure and features in the WDLF are statistically significant for all but the first and last few bins. Lower panel: V∕VMax statistic for the WDLF sample plotted in the upper panel. The expectation value for the statistic is 0.5 for a uniform sample within the survey volume (see the main text for further details).
Current usage metrics show cumulative count of Article Views (full-text article views including HTML views, PDF and ePub downloads, according to the available data) and Abstracts Views on Vision4Press platform.
Data correspond to usage on the plateform after 2015. The current usage metrics is available 48-96 hours after online publication and is updated daily on week days.
Initial download of the metrics may take a while.