Free Access
Fig. 34
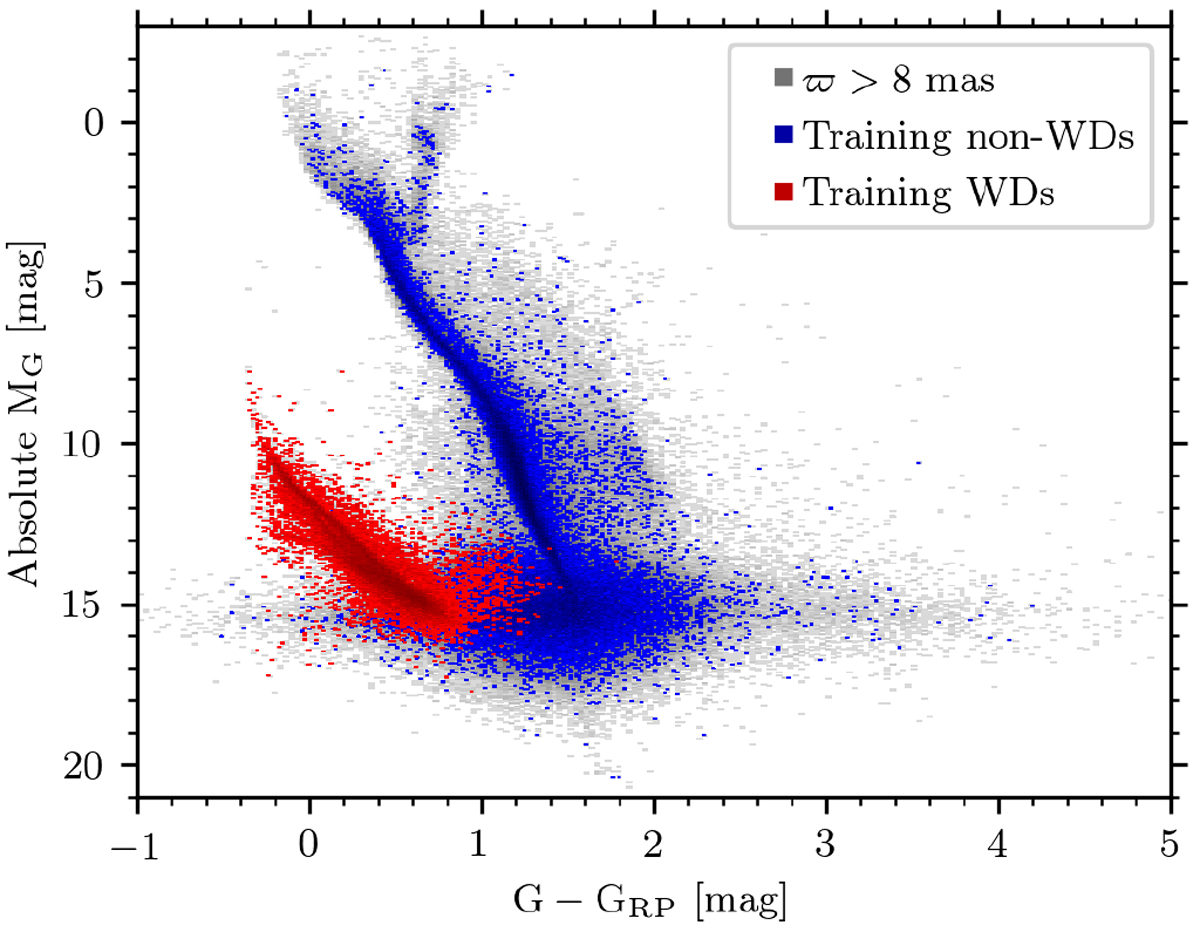
CAMD for the training dataset based on which we classified the WDs. Red data points represent the WD population. Grey points are all sources in the whole
![]() mas sample fromwhich these samples were extracted. The appearance of the test dataset is quite similar to the one plotted here.
mas sample fromwhich these samples were extracted. The appearance of the test dataset is quite similar to the one plotted here.
Current usage metrics show cumulative count of Article Views (full-text article views including HTML views, PDF and ePub downloads, according to the available data) and Abstracts Views on Vision4Press platform.
Data correspond to usage on the plateform after 2015. The current usage metrics is available 48-96 hours after online publication and is updated daily on week days.
Initial download of the metrics may take a while.