Fig. 30
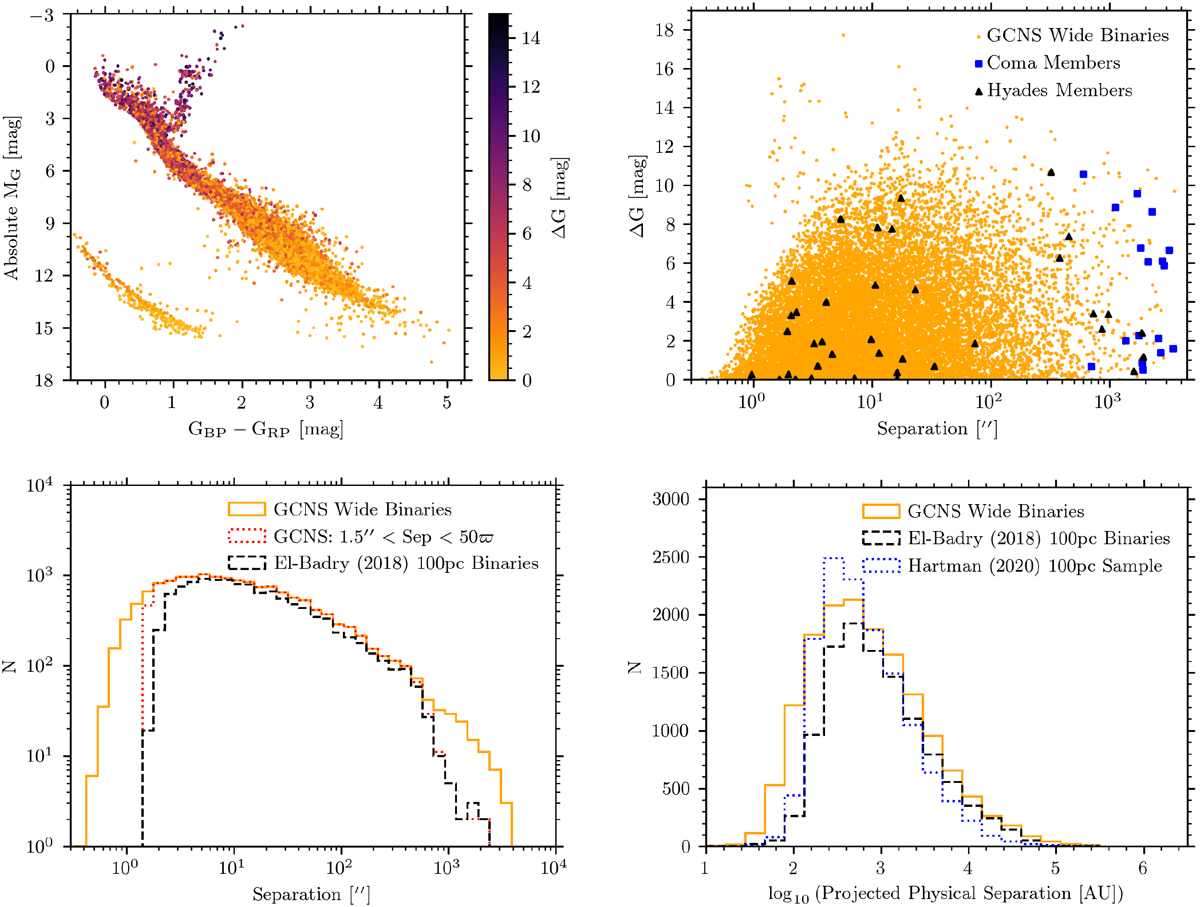
Top left: CAMD for the GCNS systems colour-coded by the magnitude differences of the binary components. Top right: separation vs. G mag difference for the resolved stellar systems in GCNS (orange points). Known members of the Hyades (black triangles) and Coma Ber (blue squares) clusters are highlighted. Bottom left: histogram (solid orange) of separations for wide binaries in the GCNS sample compared to the DR2-based catalogue (dashed black) from El-Badry & Rix (2018). The dotted red histogram corresponds to the separation distribution of GCNS wide-binary candidates adopting the exact boundaries in El-Badry & Rix (2018). Bottom right: physical projected separation distribution for the wide-binary candidates identified in this work (solid orange) compared to those from El-Badry & Rix (2018) (dashed black) and Hartman & Lépine (2020) (dotted blue), restricted to systems within 100 pc.
Current usage metrics show cumulative count of Article Views (full-text article views including HTML views, PDF and ePub downloads, according to the available data) and Abstracts Views on Vision4Press platform.
Data correspond to usage on the plateform after 2015. The current usage metrics is available 48-96 hours after online publication and is updated daily on week days.
Initial download of the metrics may take a while.