Fig. 24
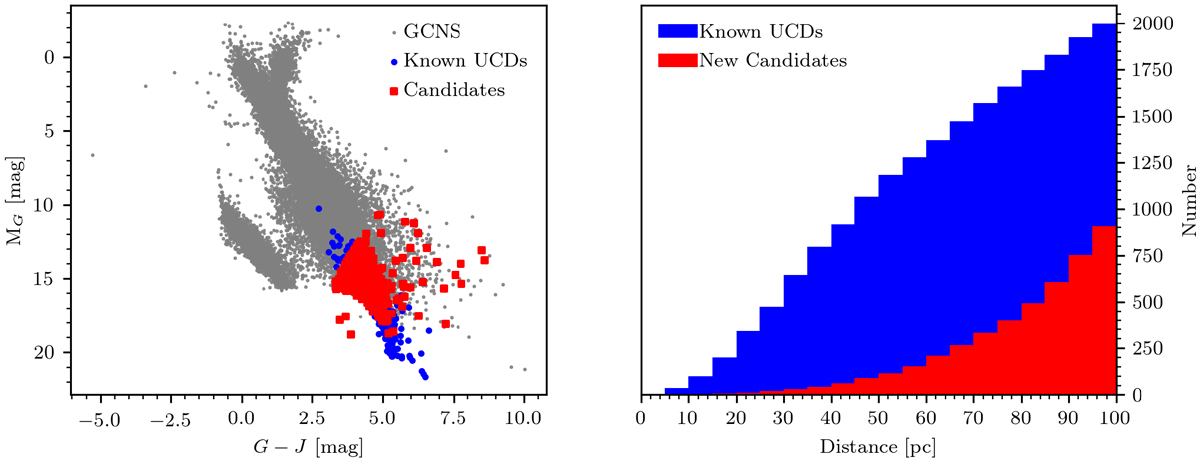
Left:MG vs. G− J diagram of stars in GCNS that are not found in Gaia DR2. The red dots are new UCD candidates, the blue points are known UCDs (spectral types between M7 and T8), and the grey points are the full GCNS sample. The new candidates are selected following the condition MG > −3 × (G − J) + 25, after removing stars whose probability of being a WD is higher than 20%. Right: distance distribution of the new candidates in the GCNS (red) and the known UCDs (blue).
Current usage metrics show cumulative count of Article Views (full-text article views including HTML views, PDF and ePub downloads, according to the available data) and Abstracts Views on Vision4Press platform.
Data correspond to usage on the plateform after 2015. The current usage metrics is available 48-96 hours after online publication and is updated daily on week days.
Initial download of the metrics may take a while.