Fig. 22
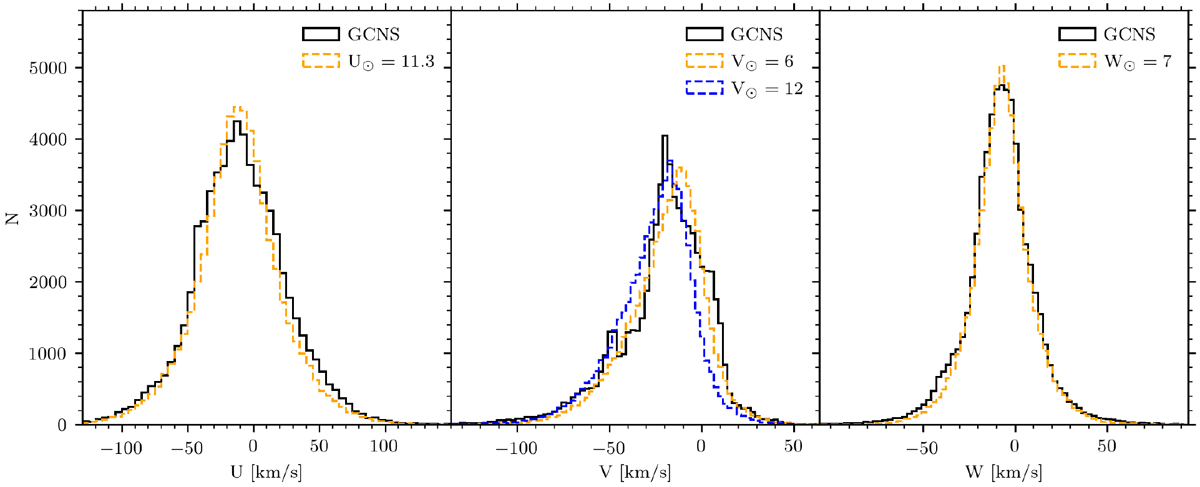
Histograms of U, V, and W velocity in GCNS catalogue with G < 13 mag (black lines) compared with simulations with distance <100 pc and G < 13 (dashed lines). The simulations assume solar velocities: U = 11.3, V = 6 km s−1 (dashed orange line), and 12 km s−1 (dashed blue line), W = 7 km s−1. The cluster members have not been removed from the data.
Current usage metrics show cumulative count of Article Views (full-text article views including HTML views, PDF and ePub downloads, according to the available data) and Abstracts Views on Vision4Press platform.
Data correspond to usage on the plateform after 2015. The current usage metrics is available 48-96 hours after online publication and is updated daily on week days.
Initial download of the metrics may take a while.