Fig. 2
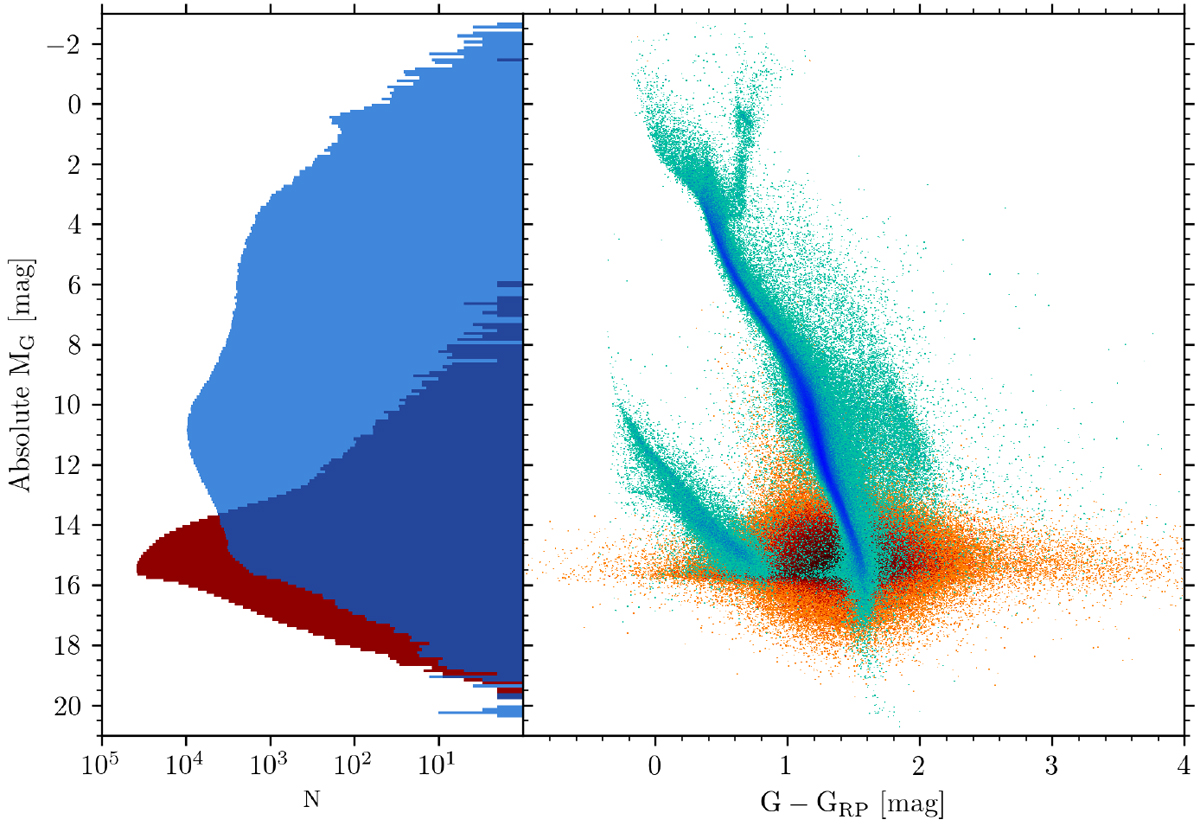
Left panel: distribution of absolute G magnitudes for the full Gaia EDR3 ![]() 8 mas sample. The blue distribution is for selected sources and the red one for rejected sources using a bin size of
8 mas sample. The blue distribution is for selected sources and the red one for rejected sources using a bin size of
![]() mag. The slight bump in the distribution of selected sources at MG = 15 mag that coincides with the maximum of the rejected sources is probably indicative of contamination. Right panel: CAMD diagram for the full sample. The blue points are good solutions and the red poor ones. The strip of source with nominally good solutions connecting the main and white dwarf sequence at
MG ~ 15 is unexpected and due to contamination of the GCNS by faint objects at distances of 80–120 pc, as discussed in Sect. 4.5.
mag. The slight bump in the distribution of selected sources at MG = 15 mag that coincides with the maximum of the rejected sources is probably indicative of contamination. Right panel: CAMD diagram for the full sample. The blue points are good solutions and the red poor ones. The strip of source with nominally good solutions connecting the main and white dwarf sequence at
MG ~ 15 is unexpected and due to contamination of the GCNS by faint objects at distances of 80–120 pc, as discussed in Sect. 4.5.
Current usage metrics show cumulative count of Article Views (full-text article views including HTML views, PDF and ePub downloads, according to the available data) and Abstracts Views on Vision4Press platform.
Data correspond to usage on the plateform after 2015. The current usage metrics is available 48-96 hours after online publication and is updated daily on week days.
Initial download of the metrics may take a while.