Fig. 16
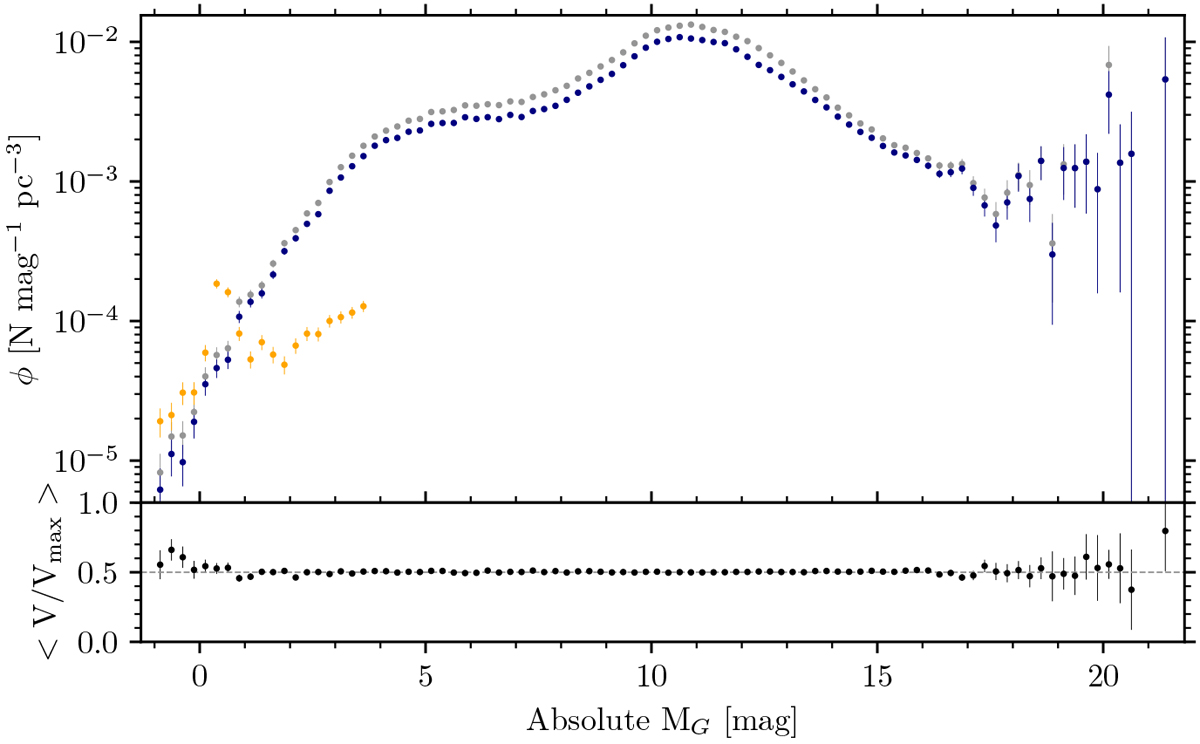
Upper panel: luminosity function of the GCNS, with a 0.25 bin, in log scale. The upper full curve plotted in grey shows main-sequence stars. The lower full curve plotted in blue points represents main-sequence stars with ipd_frac_multi_peak = 0, that is, probably single stars. The small lower partially orange curve shows giants stars. The confidence intervals reflect the Poisson uncertainties. Lower panel: ⟨ V∕Vmax ⟩ vs. MG. The expectation value for the statistic is 0.5 for a uniform sample within the survey volume.
Current usage metrics show cumulative count of Article Views (full-text article views including HTML views, PDF and ePub downloads, according to the available data) and Abstracts Views on Vision4Press platform.
Data correspond to usage on the plateform after 2015. The current usage metrics is available 48-96 hours after online publication and is updated daily on week days.
Initial download of the metrics may take a while.