Fig. 9
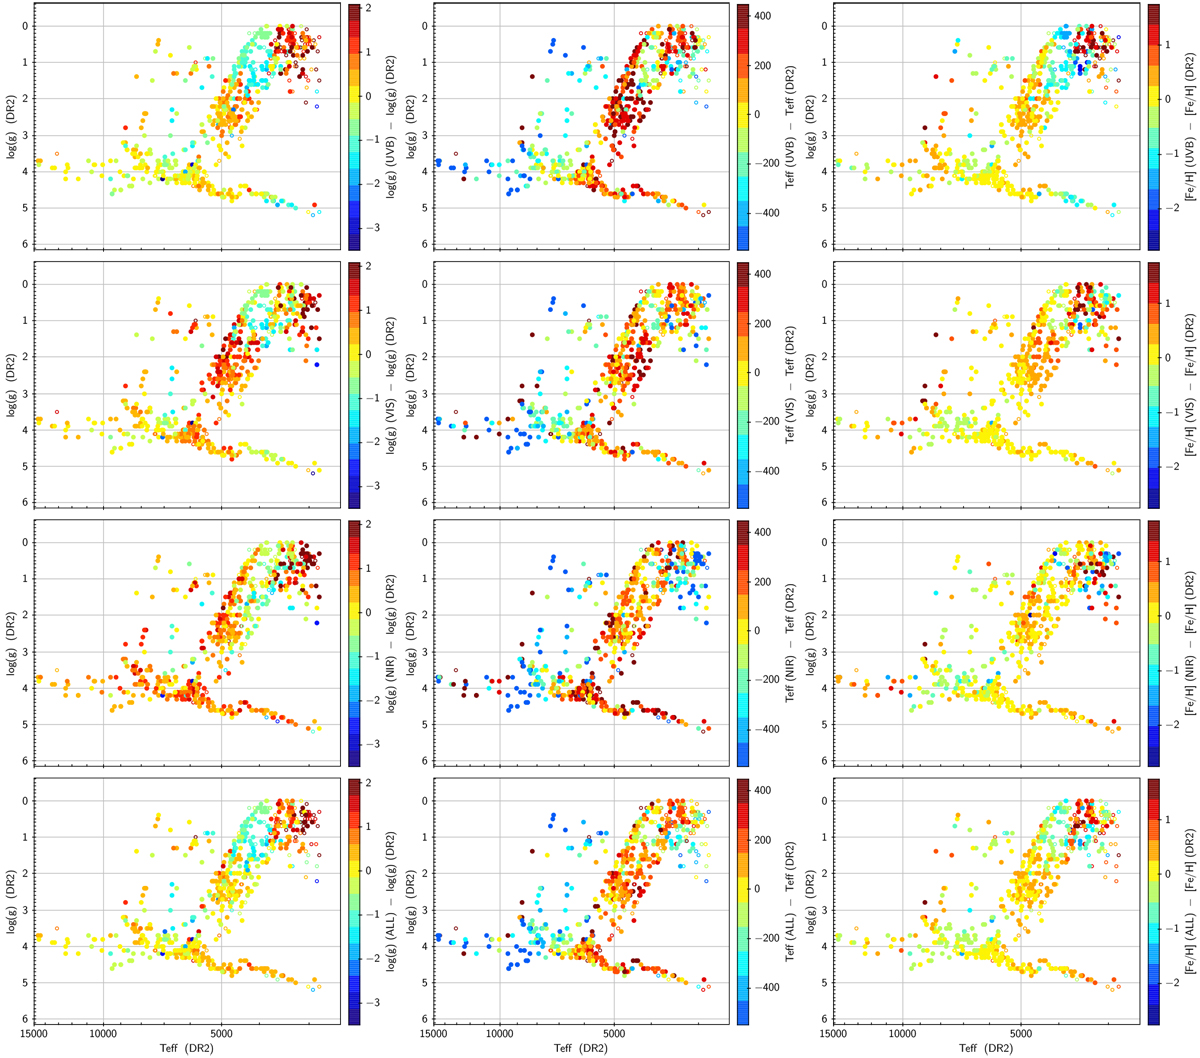
Trends in the differences between the parameters of DR2 and those from best-matching GSL SEDs as a function of position in the HR diagram. The data in the left column are colored by difference in log(g), the middle column by difference in Teff, and the right column by difference in [Fe/H]. From top to bottom, the spectral ranges used for the comparison with GSL are the UVB, the VIS, the NIR, and all three arms of X-shooter.
Current usage metrics show cumulative count of Article Views (full-text article views including HTML views, PDF and ePub downloads, according to the available data) and Abstracts Views on Vision4Press platform.
Data correspond to usage on the plateform after 2015. The current usage metrics is available 48-96 hours after online publication and is updated daily on week days.
Initial download of the metrics may take a while.