Fig. 8
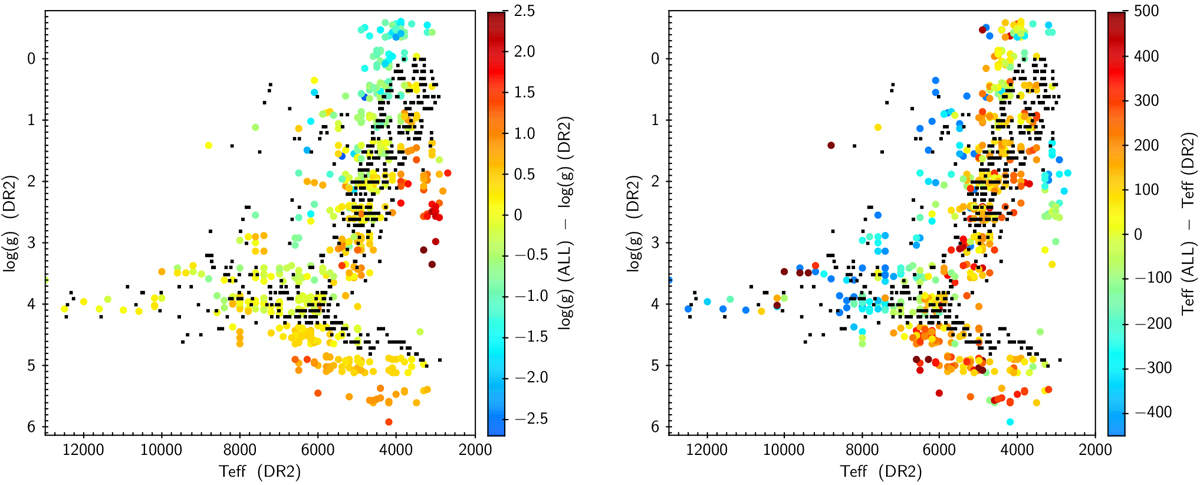
Differences between input and output gravities and temperatures across the HR diagram. The small black dots locate the XSL data according to our initial parameters, derived from the optical absorption line spectra using ULySS+MILES (Arentsen et al. 2019). The larger dots locate the same XSL data using the best-fit parameters obtained from the global comparison of the empirical spectra (UVB+VIS+NIR) with GSL models, reddened as necessary, at R = 3000. In the left panel color codes the differences in log(g) betweenthe two estimates; in the right panel it codes the differences in Teff.
Current usage metrics show cumulative count of Article Views (full-text article views including HTML views, PDF and ePub downloads, according to the available data) and Abstracts Views on Vision4Press platform.
Data correspond to usage on the plateform after 2015. The current usage metrics is available 48-96 hours after online publication and is updated daily on week days.
Initial download of the metrics may take a while.